DEA Waterbodies (Landsat)
DEA Waterbodies (Landsat)
Vector product
- Version:
- Type:
Derivative, Vector
- Coverage:
1986 to Present
- Data updates:
Daily frequency, Ongoing
About
Locate over 300,000 waterbodies across Australia and look back at their changes over three decades with Digital Earth Australia (DEA) Waterbodies. Monitor critical lakes and dams, including hard-to-reach waterbodies in remote areas and on large properties.
Note:
The update from version 2 to version 3.0 of the DEA Waterbodies product and service was created through a collaboration between Geoscience Australia, the National Aerial Firefighting Centre, Natural Hazards Research Australia, and FrontierSI to make the product more useful in hazard applications.
Geoscience Australia, the National Aerial Firefighting Centre, Natural Hazards Research Australia, and FrontierSI advise that the information published by this service comprises general statements based on scientific research. The reader is advised and needs to be aware that such information may be incomplete or unable to be used in any specific situation. No reliance or actions must therefore be made on that information without seeking prior expert professional, scientific and technical advice. To the extent permitted by law, FrontierSI, Geoscience Australia, the National Aerial Firefighting Centre and Natural Hazards Research Australia (including its employees and consultants) are excluded from all liability to any person for any consequences, including but not limited to all losses, damages, costs, expenses and any other compensation, arising directly or indirectly from using this publication (in part or in whole) and any information or material contained in it.
Access the data
For help accessing the data, see the Access tab.
Key specifications
For more specifications, see the Specifications tab.
Technical name |
Geoscience Australia Landsat Waterbodies Collection 3 |
DOI |
|
Currency |
|
Parent product |
|
Collection |
|
Licence |
Cite this product
Data citation |
Dunn, B., Krause, C., Newey, V., Lymburner, L., Alger, M.J., Adams, C., Yuan, F., Ma, S., Barzinpour, A., Ayers, D., McKenna, C., Schenk, L. 2024. Digital Earth Australia Waterbodies v3.0. Geoscience Australia, Canberra. https://dx.doi.org/10.26186/148920
|
Paper citation |
Krause, C.E., Newey, V., Alger, M.J. and Lymburner, L., 2021. Mapping and Monitoring the Multi-Decadal Dynamics of Australia’s Open Waterbodies using Landsat. Remote Sensing, 13, 1437. https://doi.org/10.3390/rs13081437
|
Publications
Krause, C.E., Newey, V., Alger, M.J. and Lymburner, L., (2021). Mapping and Monitoring the Multi-Decadal Dynamics of Australia’s Open Waterbodies using Landsat. Remote Sensing, 13, 1437. https://doi.org/10.3390/rs13081437
Mueller, N., Lewis, A., Roberts, D., Ring, S., Melrose, R., Sixsmith, J., Lymburner, L., McIntyre, A., Tan, P., Curnow, S., and Ip, A. (2016). Water observations from space: Mapping surface water from 25 years of Landsat imagery across Australia. Remote Sensing of Environment, 174, 341–352. https://doi.org/10.1016/j.rse.2015.11.003
Background
DEA Waterbodies provides up-to-date information about the extent and location of surface water in Australia to enable us to understand this valuable and increasingly scarce resource.
The product uses Geoscience Australia’s archive of over 30 years of Landsat satellite imagery to identify the locations of over 300,000 waterbodies in the Australian landscape and also estimates the wet surface area within these waterbodies.
DEA Waterbodies applies a water classification to each available Landsat satellite image and maps the locations of waterbodies across Australia. It provides a time series of wet surface area for all waterbodies that are present more than 10% of the time between 1987 and 2020, and are larger than 2,700 m2 (the size of 3 Landsat pixels).
The tool indicates changes in the wet surface area of waterbodies over time. This can be used to identify when waterbodies are increasing or decreasing in wet surface area.
Applications
Understand surface water dynamics over time on a local or national scale.
Provide supporting information to facilitate better water management across Australia.
Gain insights into the severity and spatial distribution of drought.
Identify potential water sources for aerial firefighting.
Get deeper insight into DEA Water Observations data.
Technical information
The DEA Waterbodies product is comprised of two key components:
Mapped waterbody outlines — a polygon dataset of the programmatically generated waterbody outlines.
Surface area time series — a CSV time series for each polygon of its surface area over time within the mapped polygon (for every available, clear Landsat observation).
The code used in the development of this product is available on GitHub.
Data Specification Tables
The DEA Waterbodies v3.0.0 shapefile and CSV contain the following data.
Download the Data Specification Tables as a PDF
Data specification table for DEA Waterbodies 3.0.0 Shapefile
Field name |
Description |
Update frequency |
Data availability*** |
Status^ |
Type |
|---|---|---|---|---|---|
|
A unique identifier determined from waterbody location and data version. |
Once per version |
Shapefile, DEA Maps, WMS, CSV |
Existing |
String |
|
Perimeter of the defined waterbody (m). |
Once per version |
Shapefile, DEA Maps, WMS |
Existing |
Real |
|
Area of the defined waterbody (m2). |
Once per version |
Shapefile, DEA Maps, WMS |
Existing |
Real |
|
The last date any water was observed. This is subject to the satellite having clear visibility of the waterbody. The satellite must view 80% of a waterbody to have a valid wet observation recorded. |
As scene input data is available* |
DEA Maps, WMS |
New |
DateTime (UTC) |
|
The total estimated wet surface area calculated from the last clear satellite observation of the waterbody. Calculated as the wet percentage ( |
As scene input data is available* |
DEA Maps, WMS |
New |
Real |
|
The most recent date that the satellite passed over the waterbody. |
As scene input data is available* |
DEA Maps, WMS |
New |
DateTime (UTC) |
|
The date that the |
As scene input data is available* |
DEA Maps, WMS |
New |
DateTime (UTC) |
|
The date the polygons were created. |
Once per version |
Shapefile, DEA Maps, WMS |
New |
DateTime (UTC) |
|
The metadata URL for this dataset. |
Once per version |
Shapefile, DEA Maps, WMS |
New |
String |
|
The Amazon S3 location of the wet percentage time series for this waterbody. The timeseries data is stored in a CSV file with the following columns: |
Value is static, but the CSV contents are updated as scene input data becomes available* |
Shapefile, DEA Maps, WMS |
Existing |
String |
Data specification table for DEA Waterbodies 3.0.0 Timeseries CSV
Field name |
Description |
Update frequency |
Data availability |
Status |
Type |
|---|---|---|---|---|---|
|
Date of observation (UTC) |
Value is static, but the CSV contents are updated as scene input data becomes available.* |
DEA Maps, CSV |
Existing |
DateTime (UTC) |
|
Percentage of the waterbody recorded as wet (0–100) |
Value is static, but the CSV contents are updated as scene input data becomes available.* |
DEA Maps, CSV |
Existing |
Float |
|
Number of 30m Landsat pixels recorded as wet |
Value is static, but the CSV contents are updated as scene input data becomes available.* |
DEA Maps, CSV |
Existing |
Integer |
Notes
* Scene data is available approximately two weeks from the satellite overpass for the Water Observations feature layers used to process Waterbodies. Waterbodies scenes are processed as Water Observations feature layer scenes become available in the DEA datacube. It takes approximately 10 minutes to process Waterbodies per scene. One Landsat scene measures approximately 190 x 180 km. https://www.nasa.gov/wp-content/uploads/2015/04/landsat_9_fast_facts.pdf
** Larger waterbodies are easier to detect and smaller or narrower waterbodies are harder to detect. Area estimates should be compared to additional data for verification.
*** Data fields empty in shapefile (dt_wetobs, wet_sa_m2, dt_satpass, dt_updated) are available for the latest relevant observations only via DEA Maps and WMS.
^ Data fields introduced in v3.0.0 are ‘New’.
Lineage
This product is based on DEA Water Observations which it extends with reanalysis and mapping.
Producing DEA Waterbodies polygons
DEA Waterbodies is a polygon-based view of DEA Water Observations (DEA WO), derived through the automatic processing of DEA WO to identify the outlines of persistent waterbodies across Australia.
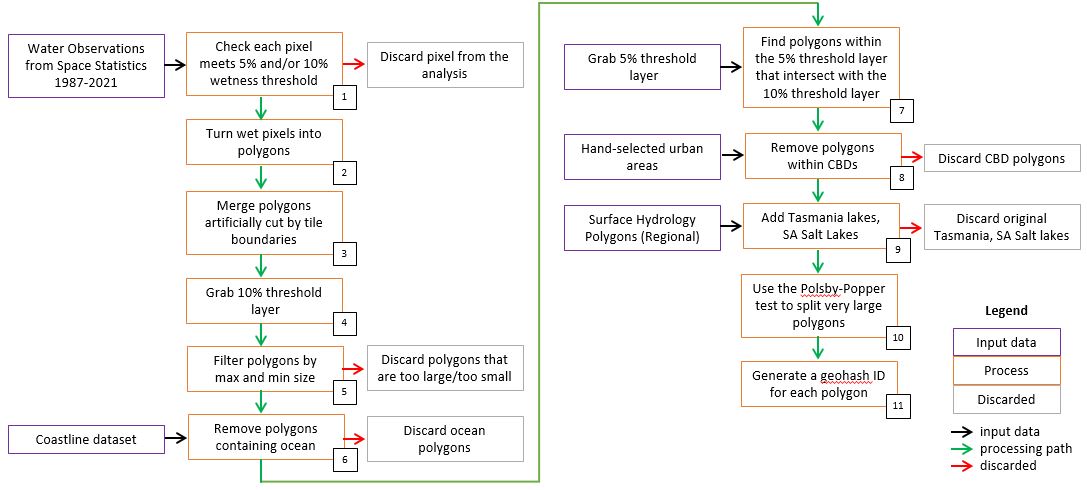
Flow diagram outlining the steps taken to produce DEA Waterbodies polygons.
For a detailed discussion of the methods used to produce DEA Waterbodies v1, refer to Krause et al. 2021. For the differences between DEA Waterbodies v1, v2 and v3.0.0, refer to the Changelog. DEA Waterbodies v3.0.0 uses the same polygon/vector outlines as DEA Waterbodies v2, with additional metadata.
References
Krause, C.E., Newey, V., Alger, M.J. and Lymburner, L., (2021). Mapping and Monitoring the Multi-Decadal Dynamics of Australia’s Open Waterbodies using Landsat. Remote Sensing, 13, 1437. https://doi.org/10.3390/rs13081437
Mueller, N., Lewis, A., Roberts, D., Ring, S., Melrose, R., Sixsmith, J., Lymburner, L., McIntyre, A., Tan, P., Curnow, S., and Ip, A. (2016). Water observations from space: Mapping surface water from 25 years of Landsat imagery across Australia. Remote Sensing of Environment, 174, 341–352. https://doi.org/10.1016/j.rse.2015.11.003
Accuracy
For a full discussion of the accuracies and limitations of DEA Waterbodies, please refer to Krause et al. 2021.
This product shows the wet surface area of waterbodies as estimated from satellites. It does not show depth, volume, purpose of the waterbody, nor the source of the water. Larger waterbodies are easier to detect, and smaller or narrower waterbodies are harder to detect. Area estimates should be compared to additional data for verification.
Inaccuracies inherited from DEA Water Observations (WO)
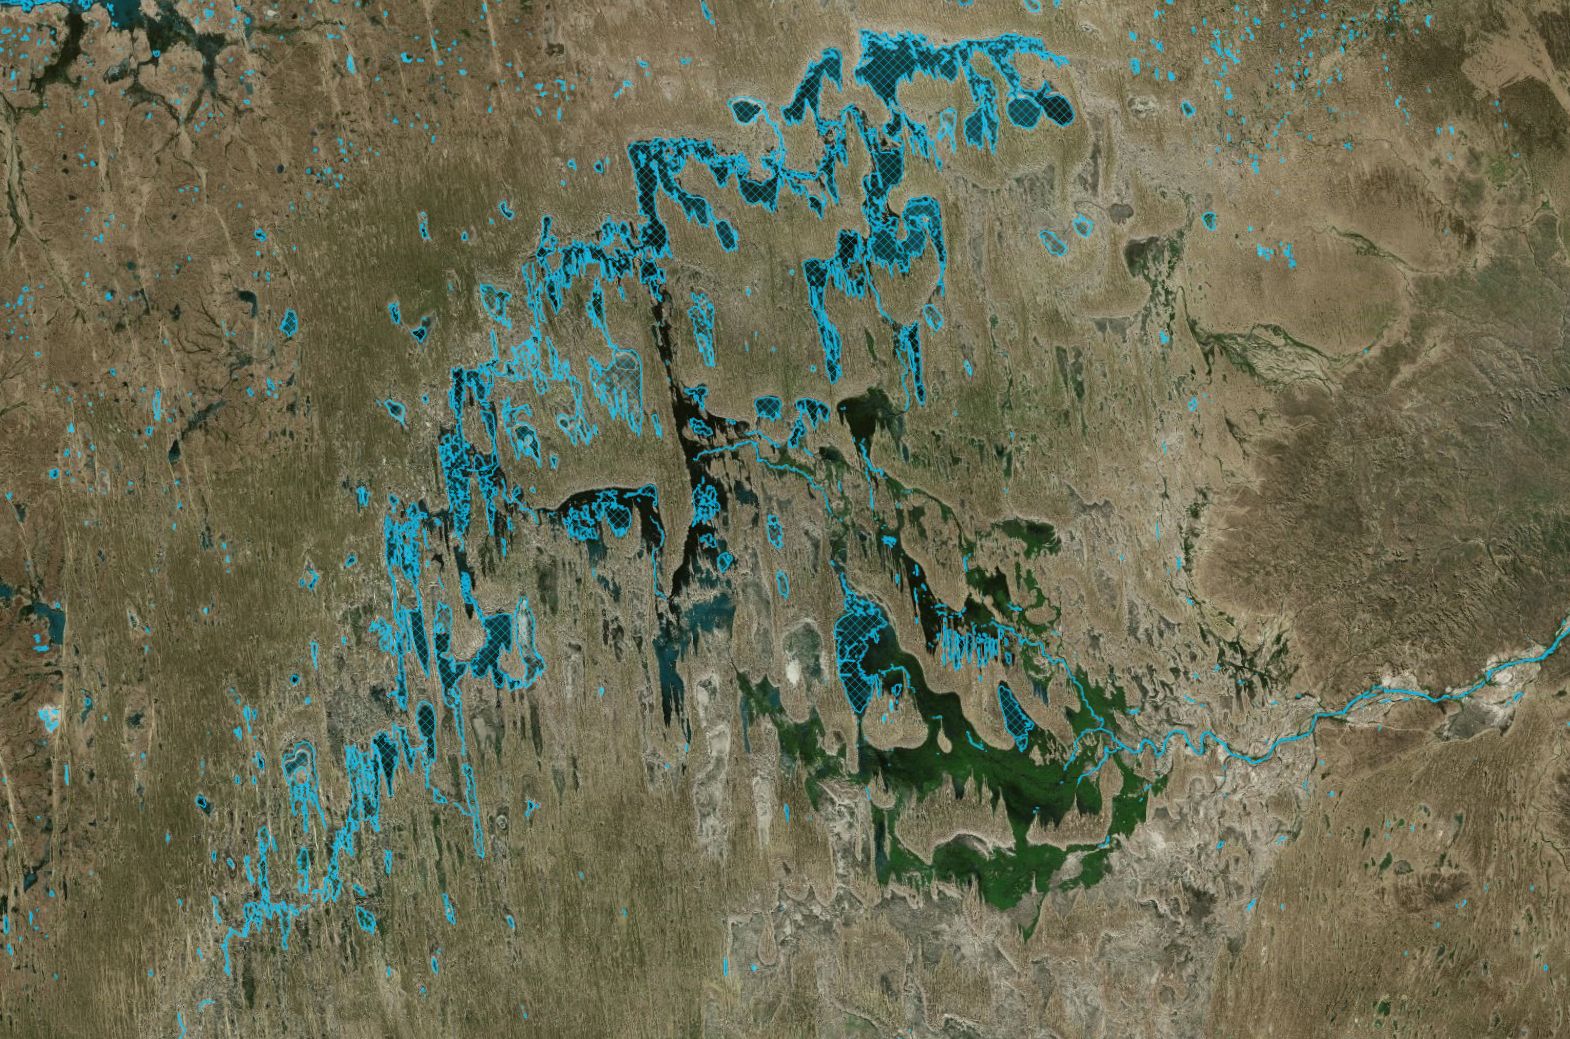
Many of the inaccuracies and limitations of DEA Waterbodies polygons are inherited from the DEA Water Observations (WO) product on which it is based. WO has a number of known limitations, affecting the classification of DEA Waterbodies. WO uses the spectral signature of water to classify wet pixels and is known to be less accurate in locations where water and vegetation are mixed. This includes locations such as rivers with vegetated riparian zones and vegetated wetlands. The effect of this can be seen by the discontinuity of narrower river features identified within DEA Waterbodies and an under-representation of water within vegetated wetlands, such as the Macquarie Marshes, NSW.
Other known WO limitations have been minimised by our filtering processes used to produce the DEA Waterbodies polygons. Issues with mixed water and vegetation pixels around features like small farm dams have been avoided by limiting the size of mapped waterbodies to at least three Landsat pixels. Misclassification of dark shadows as water in high-density cities has been handled by removing any waterbody polygons within CBDs. Intermittently misclassified features — which return valid results only a handful of times over the 32-year study period — are also filtered out by testing for the number of valid observations returned for each pixel.
Despite these fixes, some errors remain in the final waterbodies dataset. Steep terrain shadows present a known difficulty for the WO classifier, due to the presence of dark shadows. While WO has attempted to mitigate this issue, some misclassification remains. We have not specifically attempted to address these errors within this version of the product. As such, a negligible number of the identified waterbodies may in fact be artifacts caused by terrain shadow. The signal-to-noise ratio over deep water areas has also not been addressed here and may result in some pixels missing from the centre of deep waterbodies. This may result in some doughnut-shaped mapped polygons. Similarly, different water colours may interfere with the decision-tree classifier, resulting in very turbid or coloured waterbodies being misclassified.
The automatic cloud-masking algorithm used in this analysis can misclassify bright, white sands seen on the bottom of some waterbodies as clouds. This issue is particularly problematic where these bright sands are only exposed when the waterbody begins to empty, resulting in the bright sands being seen inconsistently over time. It is very difficult to accurately cloud-mask these sands as they are seen in some scenes but not others, in the same way that clouds come and go between scenes. When these sands are incorrectly classified as cloud, the scene is thrown out as being unsuitable resulting in very few ‘clear’ scenes. In this version of DEA Waterbodies, we note it as a limitation that results in short or missing time series.
Some larger salt lakes in Australia have very few records currently available due to this issue. If less than 90% of the total waterbody is observed on any one day, due to cloud cover or missing data, then that observation is marked as a missing value. For larger bodies, which may cross multiple swath boundaries or suffer from misclassifications, this can be problematic.
For a full discussion of the limitations and accuracy of WO, see Mueller et al. 2016.
Product information
This metadata provides general information about the product.
Short name |
DEA Waterbodies (Landsat) |
The name that is commonly used to refer to the product. |
Technical name |
Geoscience Australia Landsat Waterbodies Collection 3 |
The full technical name that refers to the product and its specific provider, sensors, and collection. |
Version |
3.0.0 |
The version number of the product. See the History tab. |
Lineage type |
Derivative |
Derivative products are derived from other products. |
Spatial type |
Vector |
Vector data consists of spatial polygons, lines, and points. |
Temporal coverage |
1986 to Present |
The time span for which data is available. |
Coordinate Reference System (CRS) |
The method of mapping spatial data to the Earth’s surface. |
|
Update frequency |
Daily |
The expected frequency of data updates. Also called ‘Temporal resolution’. |
Update activity |
Ongoing |
The activity status of data updates. |
Currency |
Currency is a measure based on data publishing and update frequency. |
|
Latest update date |
See Table A of the report. |
|
DOI |
The Digital Object Identifier. |
|
Catalogue ID |
The Data and Publications catalogue (eCat) ID. |
|
Licence |
See the Credits tab. |
Product categorisation
This metadata describes how the product relates to other products.
Parent product |
|
Collection |
|
Tags |
geoscience_australia_landsat_collection_3, wetness, surface_area, water, surface_water, mapping |
Access the data
DEA Maps |
Learn how to use DEA Maps. |
|
Data sources |
Learn how to access the data via AWS. |
|
Code examples |
Learn how to use the DEA Sandbox. |
|
Web services |
Learn how to use DEA’s web services. |
How to view the map
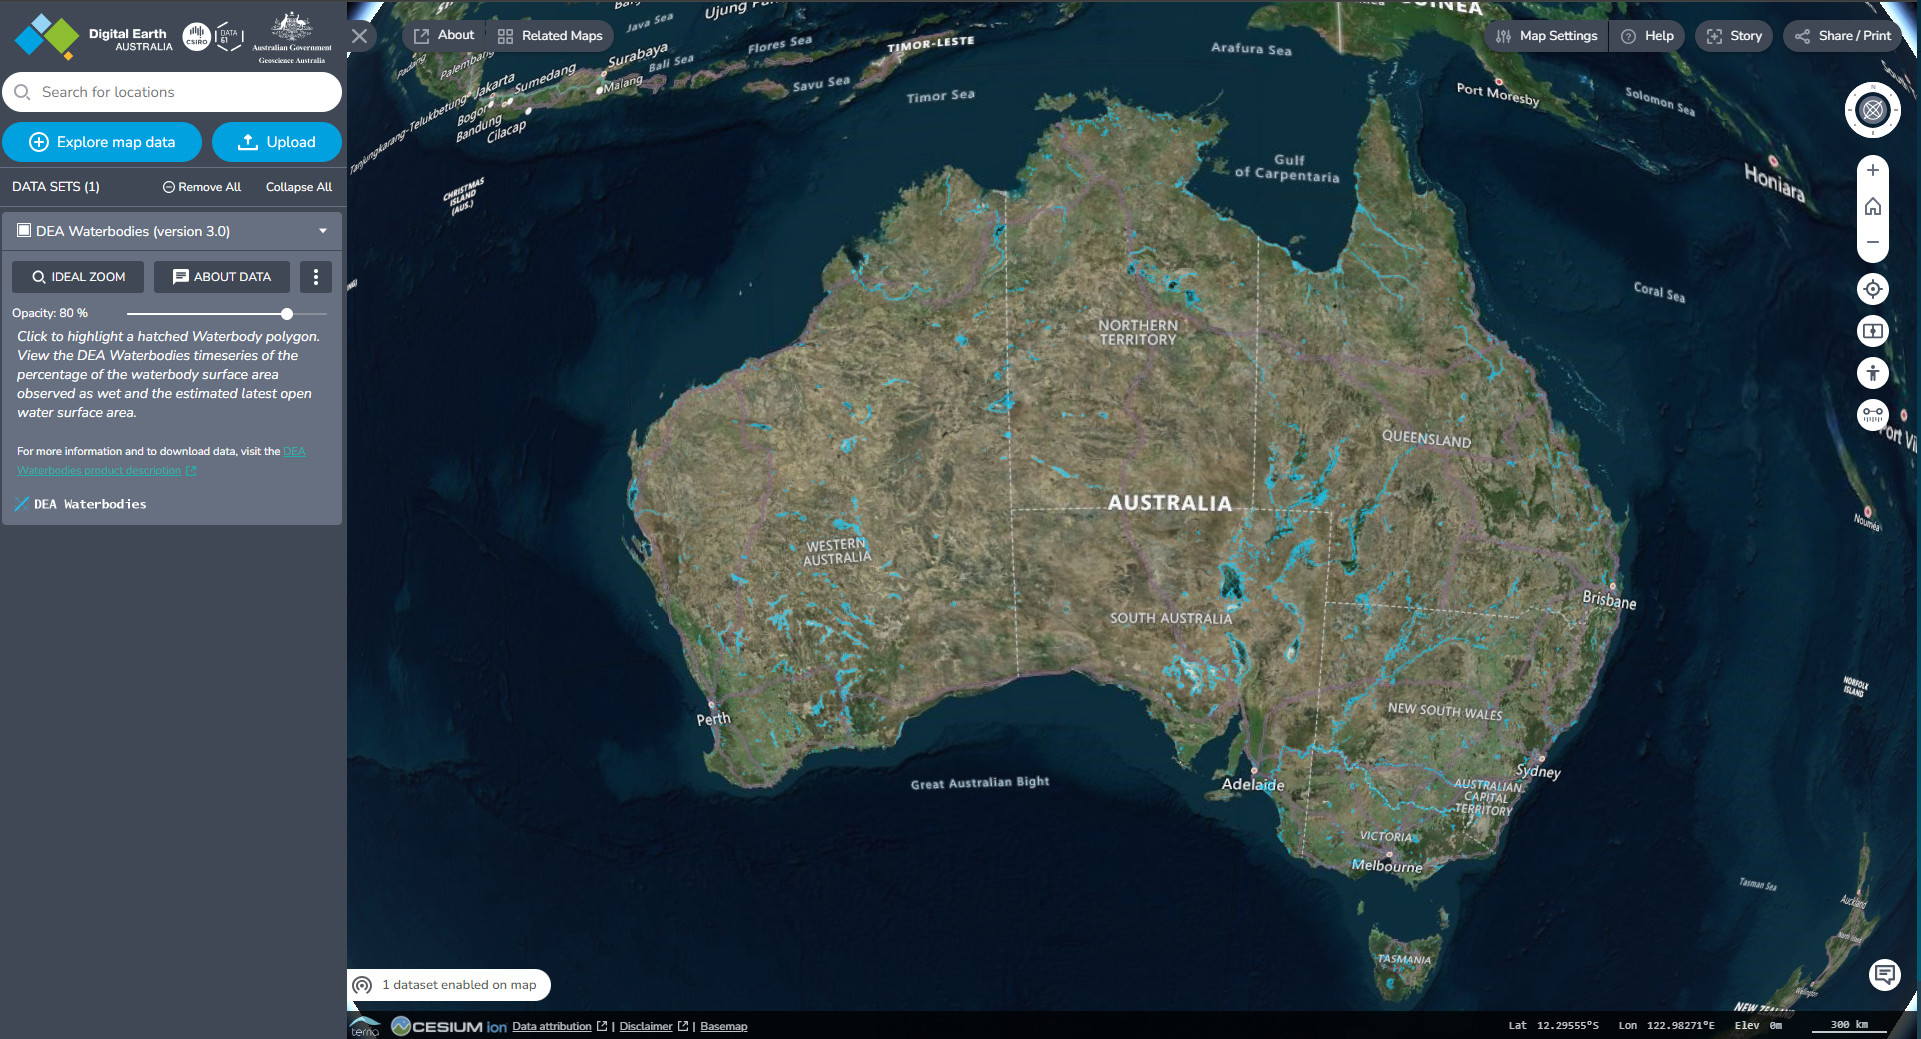
DEA Waterbodies can be viewed on the DEA Maps tool, making it easy to explore and interact with the data. To get started, open DEA Waterbodies on DEA Maps.
Or, you can manually add the DEA Waterbodies layer to DEA Maps:
Open DEA Maps.
Click Explore map data.
Select Inland water > DEA Waterbodies > DEA Waterbodies (version 3.0.0).
Click Add to the map, or the + symbol to add the data to the map.
You will now see the waterbodies overlaid on the map.
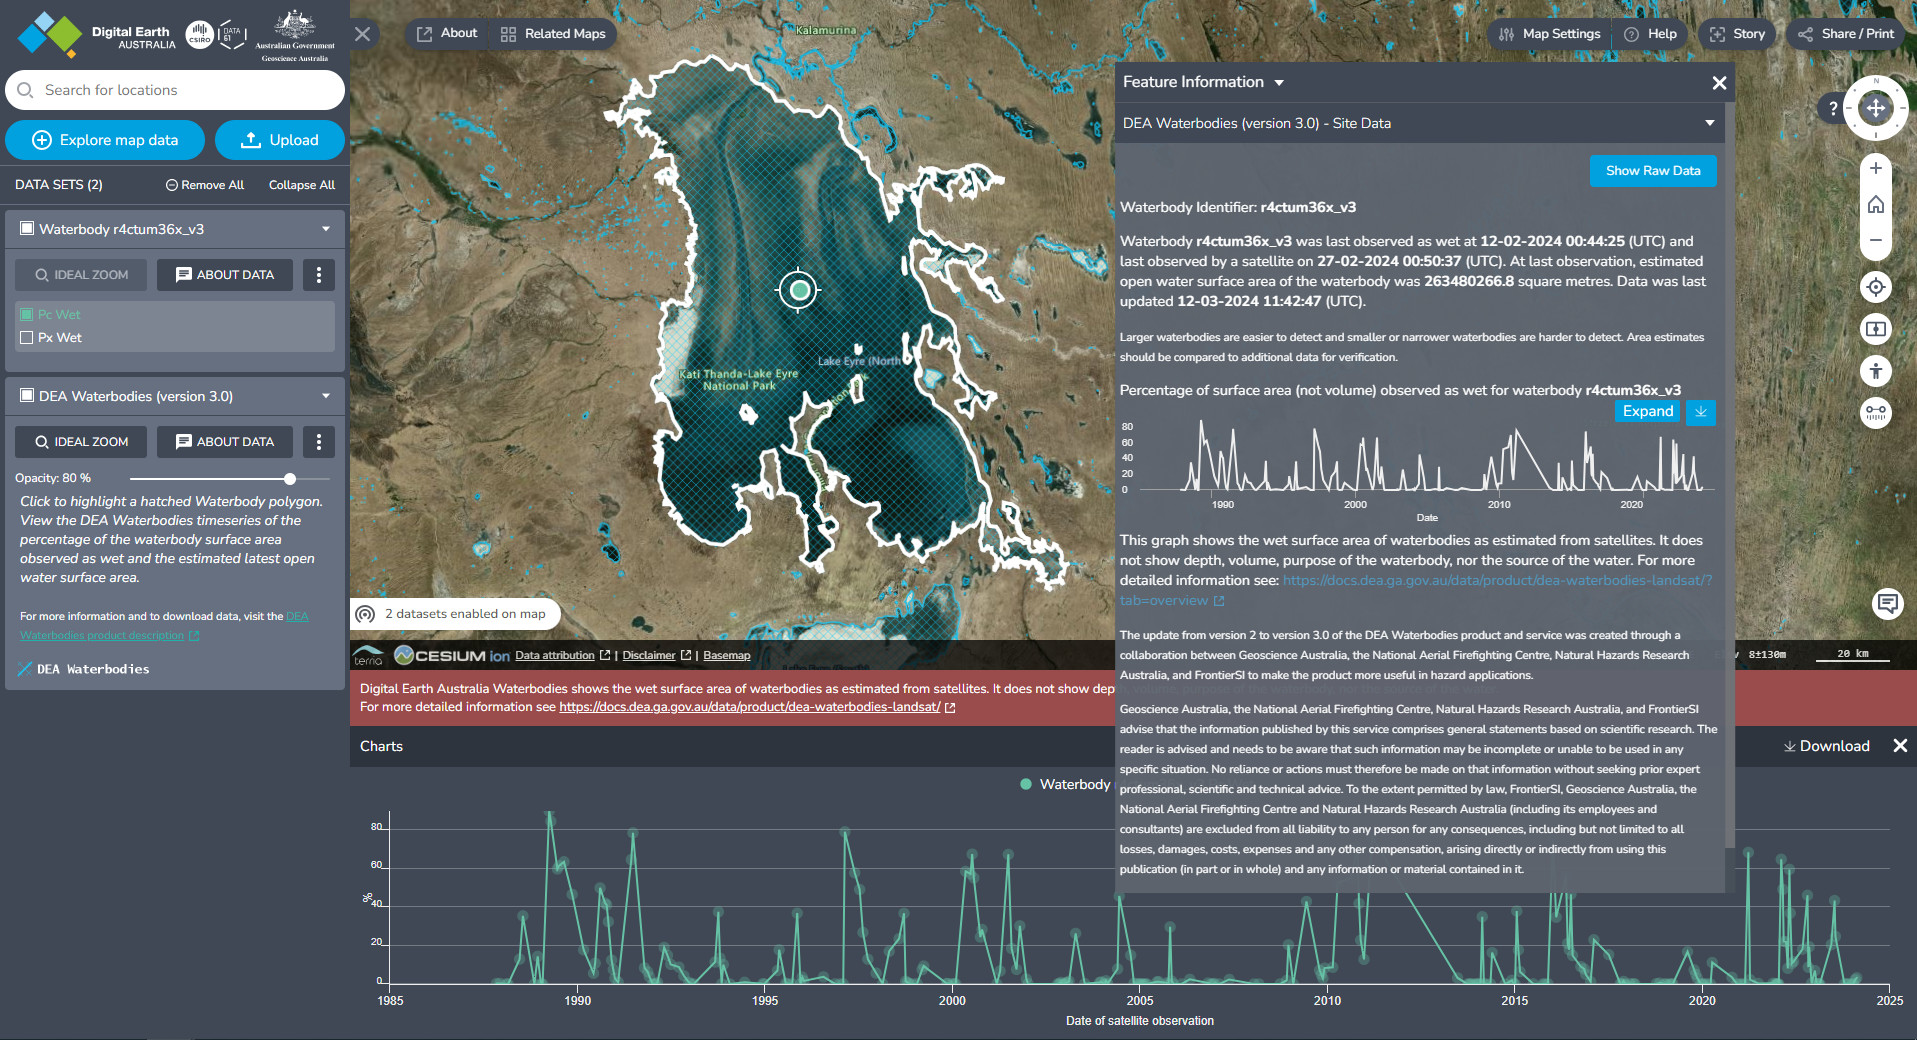
How to view more information about a waterbody
On the map, you can click any identified waterbody to view more information about it.
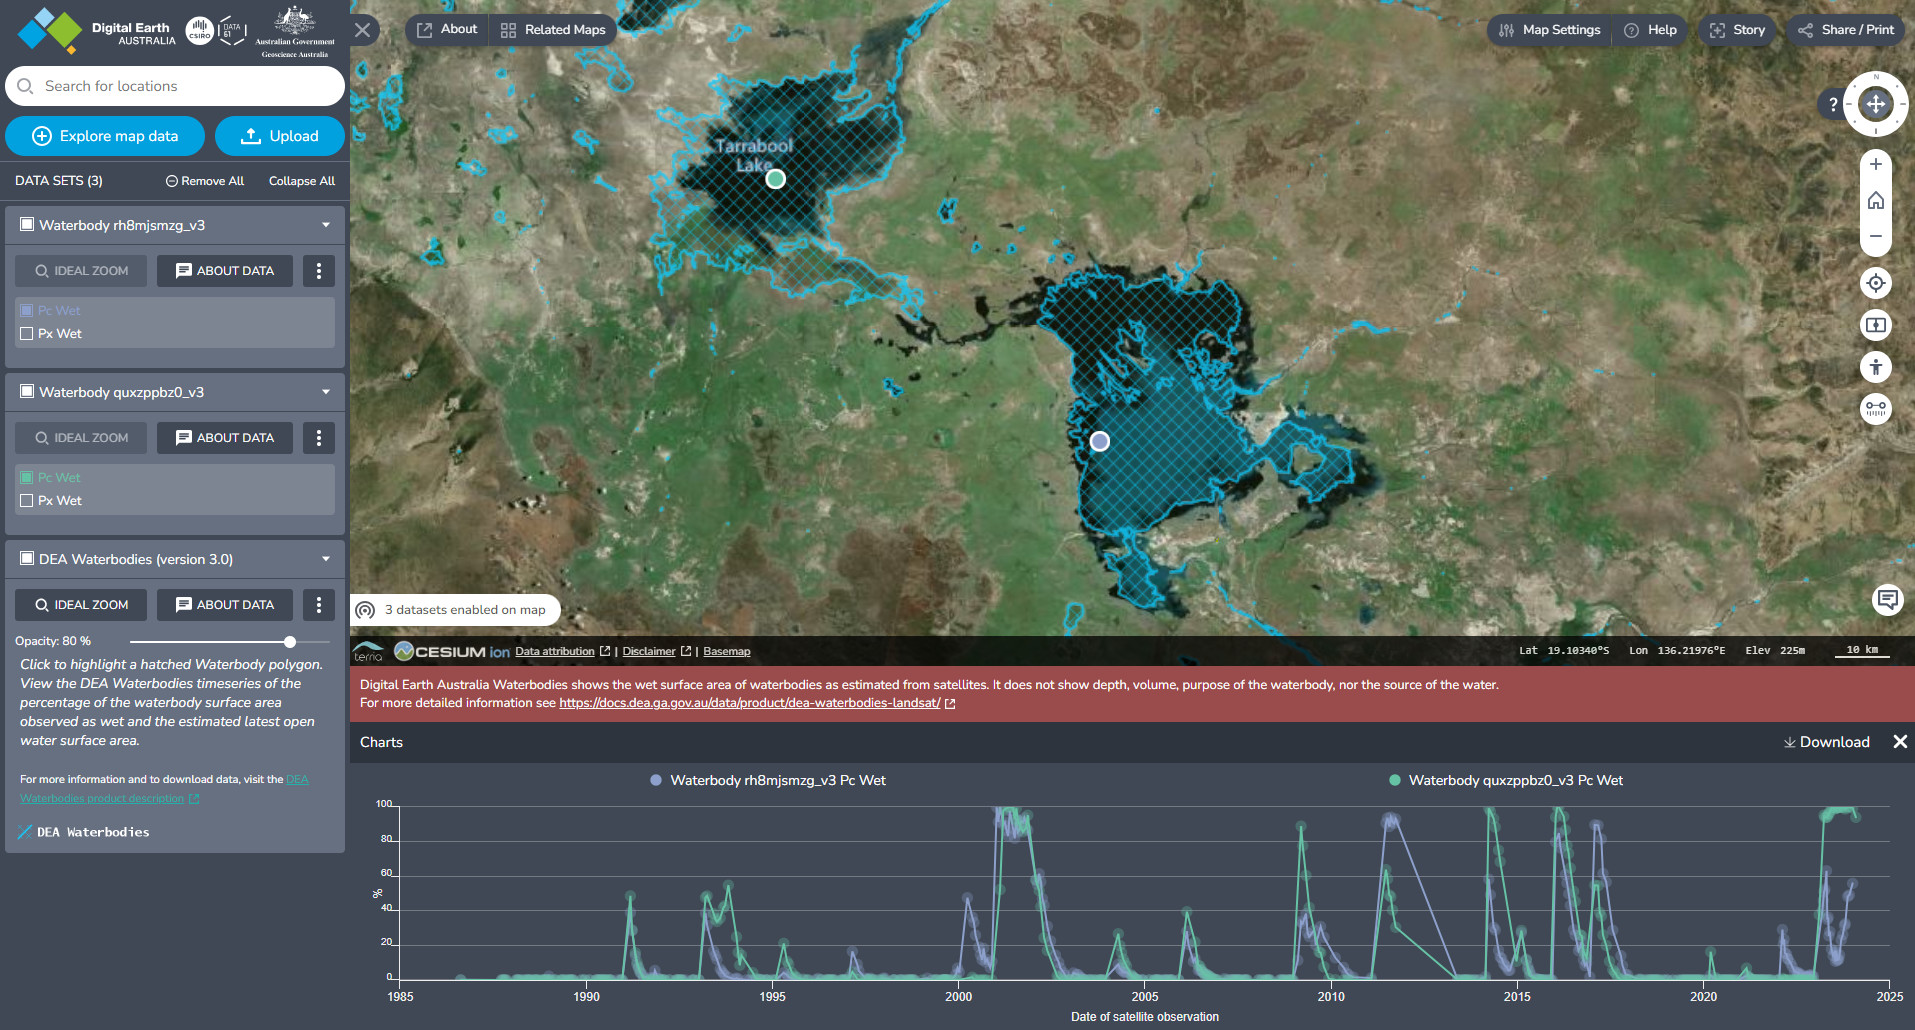
Click a waterbody and a pop-up window will appear. This contains important information about the waterbody and a preview of its ‘Pc Wet’ time series.
In the pop-up, click the Expand button. A more detailed time series chart will open below (and, the waterbody will be added to the left sidebar).
The time series chart is composed of dots representing valid observations in the data set, and straight lines are drawn between these dots.
There are two time series available for each waterbody, and you can choose to view either or both. In the left sidebar, enable or disable the checkboxes for Pc Wet and Px Wet:
Pc Wet — The ‘percentage of total surface area observed as wet’. This is the percentage of the total surface area of the waterbody that has been classified as ‘wet’ for each time step. (Note that this is not a volume.)
Px Wet — The ‘Wet Pixel Count’. This is the total number of pixels that have been classified as ‘wet’ for each time step. This value is useful if you need to calculate an area of wet pixels, since each pixel is 30 m × 30 m.
How to compare two waterbodies
Click a waterbody on the map, then in its pop-up click Expand to add it to the time series chart.
Follow the same steps to add another waterbody to the time series chart.
It’s possible to compare even more waterbodies on this chart!
Do you have any more questions?
See the Frequently Asked Questions.
If you need more help, contact earth.observation@ga.gov.au.
Version history
Versions are numbered using the Semantic Versioning scheme (Major.Minor.Patch). Note that this list may include name changes and predecessor products.
v3.0.0 |
- |
Current version |
v2.0.0 |
of |
|
v1.0.0 |
of |
Changelog
Version 3.0.0
DEA Waterbodies 3.0.0 uses the same underlying polygon set as v2.0.0 but contains several improvements. Improvements include additional supporting data for the most recent observations available through web mapping services (WMS) and DEA Maps, more metadata availability, and pipeline improvements.
The update from version 2.0.0 to version 3.0.0 of the DEA Waterbodies product and service was created through a collaboration between Geoscience Australia, the National Aerial Firefighting Centre, Natural Hazards Research Australia, and FrontierSI to make the product more useful in hazard applications.
Additional supporting data
New supporting data has been added to DEA Maps and web services for the most recent relevant observation. This data includes the following.
The last date any water was observed.
The most recent date that the satellite passed over the waterbody.
The date when attributes were updated.
The date that polygons of waterbody boundaries were created.
The dataset metadata link.
Specifications of supporting data are now available. Data will be uploaded as soon as it is received and processed. There is an approximate 2-week latency in processing of the satellite imagery to an Analysis Ready Data (ARD) standard, from which the water information is then produced.
Polygon named with ‘v3’
DEA Waterbodies 3.0.0 polygon names are the same as those in v2.0.0 but the version number at the end of the name has changed from ‘v2’ to ‘v3’. For instance, Kati Thanda-Lake Eyre has been renamed from r4ctum36x_v2to r4ctum36x_v3.
Other changes
There have been additions to the shapefile specification to support data delivery. Data specification tables have been added.
Our production pipeline has been upgraded for enhanced reliability.
Decommissioning the previous version
DEA Waterbodies 2.0.0 will be decommissioned in the coming months after thoroughly testing the new version. Users will be notified before we decommission v2.0.0.
Version 2.0.0
DEA Waterbodies 2.0.0 represents a reprocessing of DEA Waterbodies version 1 on DEA Collection 3 Water Observations, as well as a few incremental improvements.
Key differences
The key difference between DEA Waterbodies v1 and v2 is the underlying satellite imagery used to derive the polygons, and to generate the accompanying CSVs. DEA Waterbodies v1 was produced on the DEA Water Observations from Space product, which was derived from DEA Surface Reflectance NBART (Landsat) collection 2 data. This dataset had a resolution of 25 m.
DEA Waterbodies v2 has been reprocessed on DEA Water Observations which has been run on collection 3 data, with a pixel resolution of 30 m. The reprocessing of DEA datasets to 30 m resolution required that DEA Waterbodies polygon generation be re-run to re-map each waterbody using the new pixel resolution.
DEA Waterbodies v2 differs from v1 in a few additional key areas:
v2 polygons have a minimum size of 2,700 m2, while v1 polygons have a minimum size of 3,125 m2.
There are new waterbodies in v2 not present in v1.
There are old waterbodies in v1 that are not present in v2, mainly including very small or rarely full polygons which no longer exceed the 10% presence threshold.
There are waterbodies in both datasets for which the outlines have changed between v1 and v2.
Change in minimum polygon size
A change in the underlying pixel size necessitated a re-evaluation of the minimum polygon size. In v1, the minimum polygon size was 3,125 m2, equating to 5 x Landsat collection 2 pixels.
In v2, the size has been lowered slightly to 2,700 m2, which equates to 3 x Landsat collection 3 pixels.
This change has resulted in the inclusion of some smaller waterbodies that were not mapped in v1.
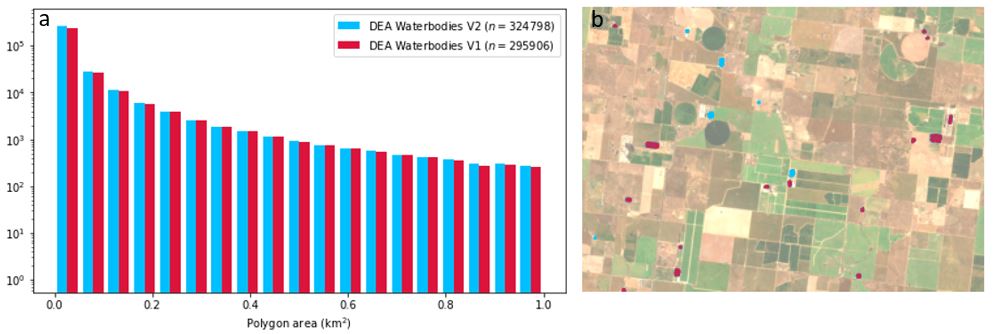
Comparison of the size distributions of DEA Waterbodies v1 and v2. a) Size distribution for polygons smaller than 1 km2. b) Small waterbodies identified in v2 that were not included in v1.
Waterbody polygons manually curated in v2
Our automated waterbody polygon detection produces subpar results for large, very rarely filled waterbodies. This is particularly true of the large salt lakes in South Australia, where our method produces thousands of smaller polygons instead of the single encompassing polygon that is typically used to map these salt lakes. These subpar results come from a combination of elevation and satellite imaging effects. To mitigate these effects, we replaced the most complex large waterbodies with their counterparts in the Surface Hydrology Polygons (Regional) dataset:
Kati Thanda-Lake Eyre (North)
Kati Thanda-Lake Eyre (South)
Lake Torrens
Lake Frome / Munda
Lake Gairdner
Lake Blanche
Lake Everard
As an example, Kati Thanda-Lake Eyre is a particularly complex polygon when mapped using automated methods, resulting in 3,118 polygons ranging from 900 m2 to 4,609 km2. Kati Thanda-Lake Eyre and Lake Everard in v1 and v2 are shown below.
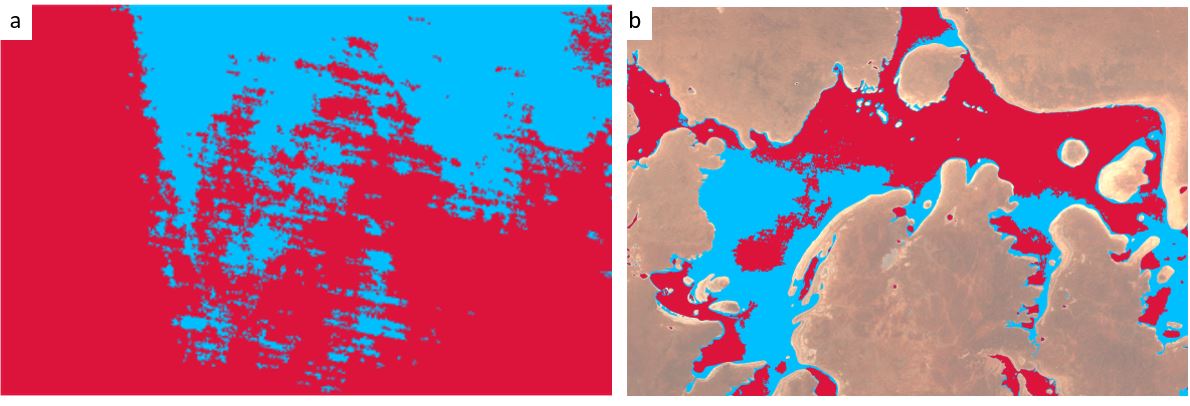
Complex polygons replaced for large salt lakes in South Australia. Original polygons are shown in red. Blue areas show where polygons were infilled by replacement with the Surface Hydrology Polygons (Regional). a) Focus on the northern edge of Kati Thanda-Lake Eyre, SA, showing the complexity of the automatically detected polygons. b) Lake Everard, SA.
Polygon names
DEA Waterbodies polygons are named using a geohash as the unique identifier for each polygon. A geohash is a representation of the latitude/longitude coordinates of the centre of each polygon, mapped into a shorter character string. Each polygon’s geohash can be converted back to a latitude/longitude pair to make it easy to locate a waterbody from its geohash alone.
Polygon names (geohashes) are not maintained between v1 and v2 of DEA Waterbodies. As in v1, v2 waterbody polygons are named according to the centroid of each polygon, which may have moved between versions. Note that characters at the end of a geohash string represent increasing precision in the accompanying latitude/longitude coordinate pair, so while the geohash is not directly maintained between versions, it is likely that they will be similar, with only the last few characters varying due to slight differences in the polygon centroids.
In order to prevent polygon identifiers being mixed up between versions, we have introduced explicit version numbers to each unique ID. This has also been applied retrospectively to v1 so that all DEA Waterbodies polygons are now named with a geohash and a version number. For example, in v1, Kati Thanda-Lake Eyre was originally r4ctk0hzm. In v1.1, the long-term release of v1, Kati Thanda-Lake Eyre was r4ctk0hzm_v1. In v2 Kati Thanda-Lake Eyre is r4ctum36x_v2.
Frequently asked questions
Here you will find answers to the most frequently asked questions about this product. If you need more help, please contact Earth.Observation@ga.gov.au.
About the waterbody graphs
Is this product showing waterbody volume?
No. DEA Waterbodies does not measure the volume of water in any waterbody.
The tool detects the wet surface area of a waterbody. The wet surface area does not correlate to the volume of water in a storage. For example, a waterbody can be observed as wet with just a shallow covering of water.
What does ‘100%’ wet surface area refer to?
The outline of each waterbody corresponds to the maximum observed wet surface area of the waterbody between 1987 and 2020. In the time series, this maximum area is considered as 100% wet surface area. The 100% wet surface area does not correlate to the volume of water in a storage. For example, a waterbody can be observed as wet with just a shallow covering of water. The maximum observed wet area is available as ‘area_m2’ in the data.
Do the time series provide information on the source of water observed?
No. This tool does not differentiate between water sources.
How often are the DEA Waterbodies time series updated?
The DEA Waterbodies time series are updated as soon as data from the satellites are available. An individual time series could be updated fortnightly or less frequently if it was cloudy on the days the satellite was overhead.
Landsat satellites do not observe all of Australia at the same time. The dates of satellite observations are dependent on the date that the satellite observed a particular waterbody. Landsat satellites take 16 days to collect data across all of Australia, with different locations being collected on different days within that 16-day interval. Landsat data is available approximately two weeks from the satellite overpass before the Water Observations feature layers used to process Waterbodies are created. Waterbodies are then processed as Water Observations feature layer scenes become available in the DEA data cube. It takes approximately ten minutes to process Waterbodies per scene, once the data is available.
Why are some time series shorter than others?
All useable observations for each waterbody have been included in the individual waterbody time series. Short or missing time series can result from frequent cloud cover, misclassification, or other processing issues.
If less than 90% of the total waterbody is observed on any one day, due to cloud cover or missing data, then that observation is marked as a missing value within the CSV file.
Cloud cover leading to invalid data can be a particular problem in coastal regions, northern Australia during summer, and in Tasmania.
Some larger salt lakes in Australia have very few records currently available. For larger waterbodies, which may cross multiple swath boundaries or suffer from misclassifications (salt lakes can be misclassified as cloud due to their brightness) this can be problematic.
How does DEA Waterbodies deal with clouds?
Data used within DEA Waterbodies is cloud masked. If less than 90% of the total waterbody is observed on any one day, due to cloud cover or missing data, then that observation is marked as a missing value.
Cloud cover leading to invalid data can be a particular problem in coastal regions, northern Australia during summer, and in Tasmania.
Why are the time series irregularly spaced in time?
Landsat satellites do not observe all of Australia at the same time. The dates of satellite observations are dependent on the date that the satellite observed that particular waterbody. Landsat satellites take 16 days to collect data across all of Australia, with different locations being collected on different days within that 16-day interval. This means that the date stamps of each time series are not common across all waterbodies. DEA Waterbodies contains data from all available Landsat satellites.
What are the two different time series provided for each waterbody?
Within the DEA Waterbodies web service, there are two time series provided for each waterbody, which can be seen in the legend panel on the left side once a waterbody has been selected, and the time series expanded:
Pc Wet — The ‘Percentage of total surface area observed as wet’. This is the percentage of the total surface area of the waterbody that has been classified as ‘wet’ for each time step. (Note: this is not a volume)
Px Wet — The ‘Wet Pixel Count’. This is the total number of pixels that have been classified as ‘wet’ for each time step. This value is useful if you need to calculate an area of wet pixels. Each pixel is 30 m by 30 m.
About the mapped waterbodies
What satellite imagery does DEA Waterbodies use?
DEA Waterbodies is based on Landsat satellite data provided by the United States Geological Survey. The Digital Earth Australia (DEA) program within Geoscience Australia calibrates this data and makes it available publicly.
The tool uses data from the Landsat 5 TM (1987–2011), Landsat 7 ETM+ (1999–present), Landsat 8 OLI (2013–present), and Landsat 9 OLI-2 (2021–present) missions.
To find out more about the Landsat missions, see the USGS Landsat Missions webpages.
How do you classify water from satellite imagery?
The water classifier that is used by DEA Waterbodies is the DEA Water Observations algorithm. It is a decision tree algorithm that classifies each pixel as ‘wet’, ‘dry’ or ‘invalid’.
For details on how the Water Observations from Space algorithm classifies water, see the paper: Water observations from space: Mapping surface water from 25 years of Landsat imagery across Australia.
How big does a waterbody have to be to be included?
DEA Waterbodies only maps waterbodies larger than 2,700 m2 (the size of 3 Landsat pixels). This size was chosen to minimise noise caused by large numbers of small wet areas in the landscape.
What does the outline of individual waterbodies represent?
The outline of each waterbody corresponds to the maximum observed wet surface area of the waterbody between 1987 and 2020, except for two cases. Long, thin waterbodies were separated into multiple polygons as described in Krause et al. 2021, and the following waterbodies were replaced by the extents from the Surface Hydrology Polygons (Regional) dataset:
Kati Thanda-Lake Eyre (North)
Kati Thanda-Lake Eyre (South)
Lake Torrens
Lake Frome / Munda
Lake Gairdner
Lake Blanche
Lake Everard
Waterbody outlines may not directly match up with the edges of a waterbody, as the edges themselves are not inundated, and so will not be captured within the wet extent. The waterbodies may also not match up with the previously mapped extent of any waterbody found in other map products.
Why do some waterbodies look pixelated?
The pixelated outlines show which satellite pixels have been included inside each waterbody. We chose not to smooth the outlines of the waterbodies to make it clear that this mapping has been done using satellite data and to make it clear which pixels have been included in each waterbodies’ time series.
Why is there is a waterbody missing from your map?
There are a few reasons why a waterbody might be missing:
It may be too small: DEA Waterbodies only maps waterbodies larger than 2,700m2 (3 whole Landsat pixels).
It may not have been wet enough: DEA Waterbodies only maps waterbodies that have been observed as wet at least 10% of the time between 1987 and 2020. If a waterbody fills very infrequently, it may not meet this threshold.
The waterbody may have too much vegetation surrounding it: the DEA Water Observations classifier that determines where water is observed does not work well where water is combined with vegetation. If there is vegetation obscuring the water (like a tree leaning across a river or a wetland), the classifier will not see this as water and the waterbody may not be mapped.
The water in the waterbody does not look like water: very sediment-filled water, particularly in northern Australia, is often misclassified as land.
It may be new: newly constructed waterbodies will not be included in this product as they will not have been observed as wet at least 10% of the time between 1987 and 2020. Waterbodies that have been constructed or modified after 2016 may not be captured within this tool. Future updates of this product should capture newer waterbodies.
If there is a waterbody missing from DEA Waterbodies that you would like to report, please contact us at dea@ga.gov.au
Reports of missing waterbodies may assist us during quality checking of future product releases.
Why are there whole/parts of rivers missing?
The DEA Water Observations classifier that determines where water is observed does not work well where water is combined with vegetation. If there is vegetation obscuring the water (like a tree leaning across a river), the classifier will not see this as water, and the waterbody will be cut short, even though the river continues along underneath the vegetation.
Additionally, the Landsat satellite data on which this dataset is based has a pixel resolution of 30 m x 30 m. A pixel will only be classified as water where the pixel is almost entirely made up of water. For example, where rivers narrow or contain large sandbanks the pixel will incorporate these other signatures, and not be classified as water.
Both of these factors mean that rivers are not seen as continuous features throughout DEA Waterbodies. Some rivers have also been split into shorter sections for ease of analysis.
Why are some of the waterbody polygons patchy?
Some of the waterbody polygons contain holes or are quite irregularly shaped. This is caused by the DEA Water Observations classifier not seeing these ‘missing bits’ as water frequently enough, and so they are excluded.
The DEA Water Observations classifier that determines where water is observed does not work well where water is combined with vegetation. If there is vegetation obscuring the water (like a tree leaning across a river or a wetland), the classifier will not see this as water and the resulting mapped waterbody may be patchy. For example, water under mangroves.
Mangroves at the mouth of Fitzroy River near Rockhampton as mapped within DEA Waterbodies.
Why are some waterbodies fused together instead of being separate?
DEA Waterbodies are mapped using water-classified pixels. If a pixel is predominantly water, it will be mapped as water. Small levees or roads between adjacent waterbodies will not necessarily separate the mapped waterbodies if they are not large enough to influence the total make up of their pixel. This means that some separate waterbodies are mapped as a single waterbody within DEA Waterbodies.
Does DEA Waterbodies show flooded areas?
By design, we have excluded locations where water is seen only during extreme flood events. A wetness threshold of 10% was applied to the data, meaning that only waterbodies observed as being wet at least 10% of the time between 1987 and 2020 are included. This threshold was determined to be sensitive enough to capture the locations of persistent waterbodies, but not so sensitive as to pick up too many false positives like flood irrigation, flood events, or soggy areas in the landscape.
Other information about DEA Waterbodies
How do I download the data?
Individual waterbody time series can be downloaded within the National Map and DEA Maps platforms.
The underlying polygon dataset containing the map of over 300,000 waterbodies across Australia can be downloaded from the Access tab.
Can I load DEA Waterbodies into my GIS software?
DEA Waterbodies has been provided as a web mapping service (WMS). You can load this service into your GIS software by connecting to the service endpoint (see the metadata provided with the layer in National Map or DEA Maps for details). Data available through this service can be viewed on the data specification tables.
How was DEA Waterbodies produced?
The code used to produce DEA Waterbodies polygons is available here. DEA Waterbodies time series generation code is also available on GitHub. There is a peer-reviewed journal article that explains in detail the methods used to produce DEA Waterbodies.
How do I cite DEA Waterbodies?
DEA Waterbodies is published by Geoscience Australia under the Creative Commons Attribution 4.0 International Licence. You can attribute the data and derivative works using the following two citations:
Dataset citation:
Dunn, B., Krause, C., Newey, V., Lymburner, L., Alger, M.J., Adams, C., Yuan, F., Ma, S., Barzinpour, A., Ayers, D., McKenna, C., Schenk, L. 2024. Digital Earth Australia Waterbodies v3.0. Geoscience Australia, Canberra. https://dx.doi.org/10.26186/148920
Research paper citation:
Krause, C.E., Newey, V., Alger, M.J. and Lymburner, L., (2021). Mapping and Monitoring the Multi-Decadal Dynamics of Australia’s Open Waterbodies using Landsat. Remote Sensing, 13, 1437. https://doi.org/10.3390/rs13081437
Who did you collaborate with to produce DEA Waterbodies?
DEA Waterbodies version 1 was the result of a collaboration between Geoscience Australia, the NSW Department of Planning, Industry and Environment, and the Murray Darling Basin Authority to determine the potential of satellite imagery to provide useful insights about water in the landscape.
The update from version 2 to version 3.0 of the DEA Waterbodies product and service was created through a collaboration between Geoscience Australia, the National Aerial Firefighting Centre, Natural Hazards Research Australia, and FrontierSI to make the product more useful in hazard applications.
How do I get more information or provide feedback on DEA Waterbodies?
Contact us at Earth.Observation@ga.gov.au
Acknowledgments
The update from version 2 to version 3.0 of the DEA Waterbodies product and service was created through a collaboration between Geoscience Australia, the National Aerial Firefighting Centre, Natural Hazards Research Australia, and FrontierSI to make the product more useful in hazard applications.
Work on version 1 of DEA Waterbodies was carried out in collaboration with the NSW Department of Planning, Industry and Environment.
License and copyright
© Commonwealth of Australia (Geoscience Australia).
Released under Creative Commons Attribution 4.0 International Licence.