Land Cover Explorer
Land Cover Explorer is a web application in the Digital Atlas of Australia, developed by Esri. It allows you to navigate and visualise the DEA Land Cover datasets. (This is an easy alternative to plotting Land Cover data yourself.)
Start exploring
Open the Land Cover Explorer (Digital Atlas)
Navigate across time and place
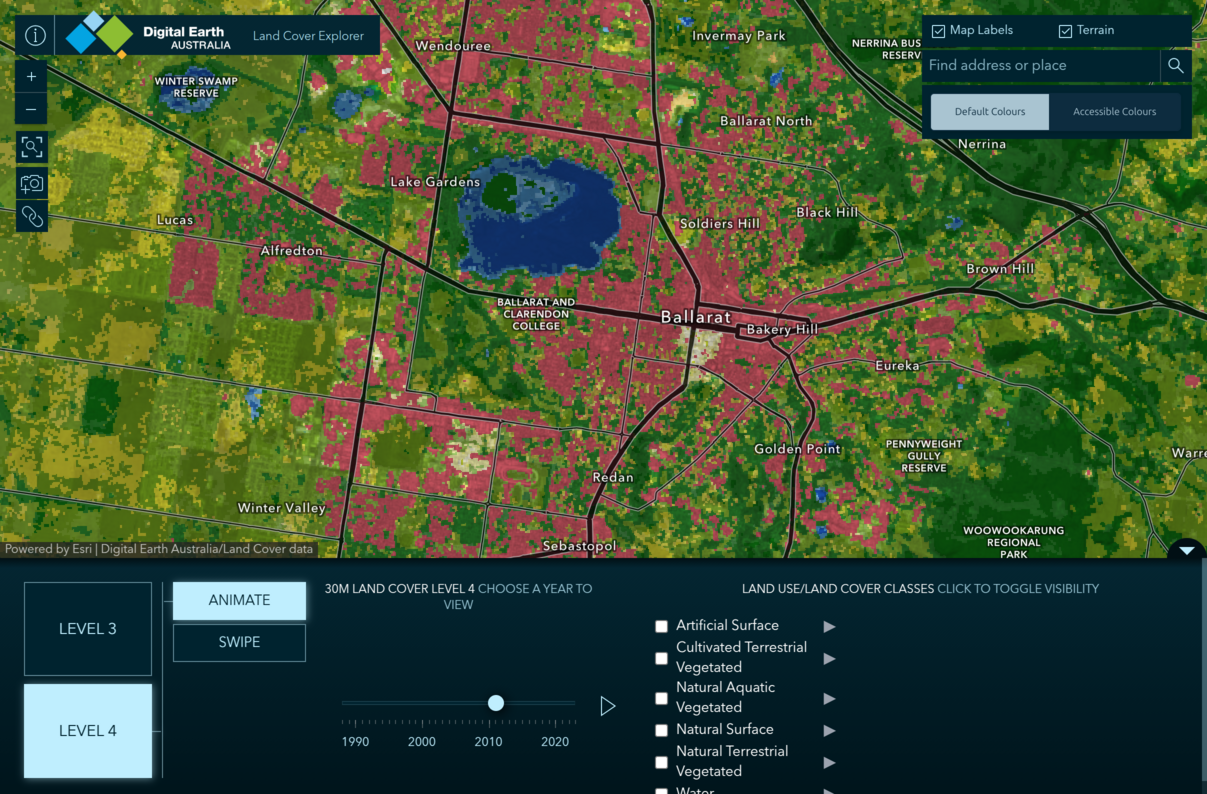
To navigate to a place on a map, use your mouse to zoom in and drag to move around. Or, enter an address or place into the search bar on the top left to jump directly to a location, e.g. “Ballarat”.
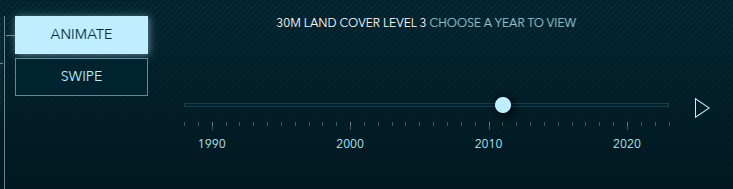
To navigate through time, ensure that Animate is selected in the bottom panel, then drag the slider underneath Choose a year to view on the bottom panel. You can view data for any year for which there is coverage, from 1988 onwards.
View Level 3
Click Level 3 in the bottom panel to view the Level 3 dataset.
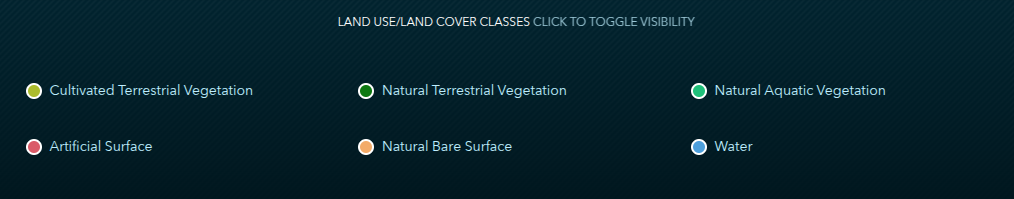
The Level 3 dataset allows viewing the six base Land Cover classes. These are displayed in the Land Use/Land Cover Classes section in the bottom panel as Cultivated Terrestrial Vegetation, Natural Terrestrial Vegetation, Natural Aquatic Vegetation, Artificial Surface, Natural Bare Surface, and Water. They are colour-coded so that you can identify them on the map.
Click on a Land Cover class to view only that selected class on the map. Click the same class again to revert to viewing all the classes on the map. (By default, all classes are displayed on the map.)
View Level 4
Click Level 4 in the bottom panel to view the Level 4 dataset.
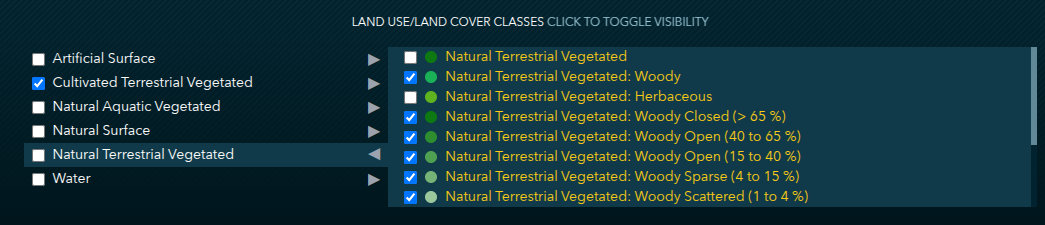
The Level 4 dataset includes the six base Land Cover classes as well as the sub-classifications of each of these. These sub-classifications each have their own colour code. You can selectively view any classification or combination of classifications on the map by using the Land Use/Land Cover Classes section in the bottom panel. (By default, all classes are displayed on the map.)
Tick the checkbox of any of the six base classes to view only that selected class on the map, including all sub-classifications.
Click the name of any of these base classes to view its sub-classifications, and tick the checkbox of any of these to selectively view them on the map.
Any combination of base classes and sub-classifications can be selectively viewed on the map.
To reset this section to the default values, tick then untick each of the base classes.
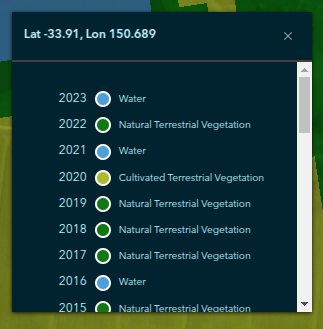
History of a location
Click any location on the map and a popup will appear showing how the classification of that coordinate changes over time. For example, you can see that at ‘Lat -33.91, Lon 150.689’, in Level 3, the classification has varied between Water, Natural Terrestrial Vegetation, and Cultivated Terrestrial Vegetation over time.
Animate changes over time
How to exit an animation: Either click “×” next to the timeline or the “×” button at the top right.
Note: This feature doesn’t currently support animating a specific selection of Land Cover classes.
To animate changes, follow these steps.
Ensure that Animate is selected in the bottom panel.
Select the year that you wish to start the animation from.
Click the “⏵” (Play) icon.
You can use the “⏸” button to pause the animation.
To exit the animation, either click “×” next to the timeline or the “×” button at the top right.
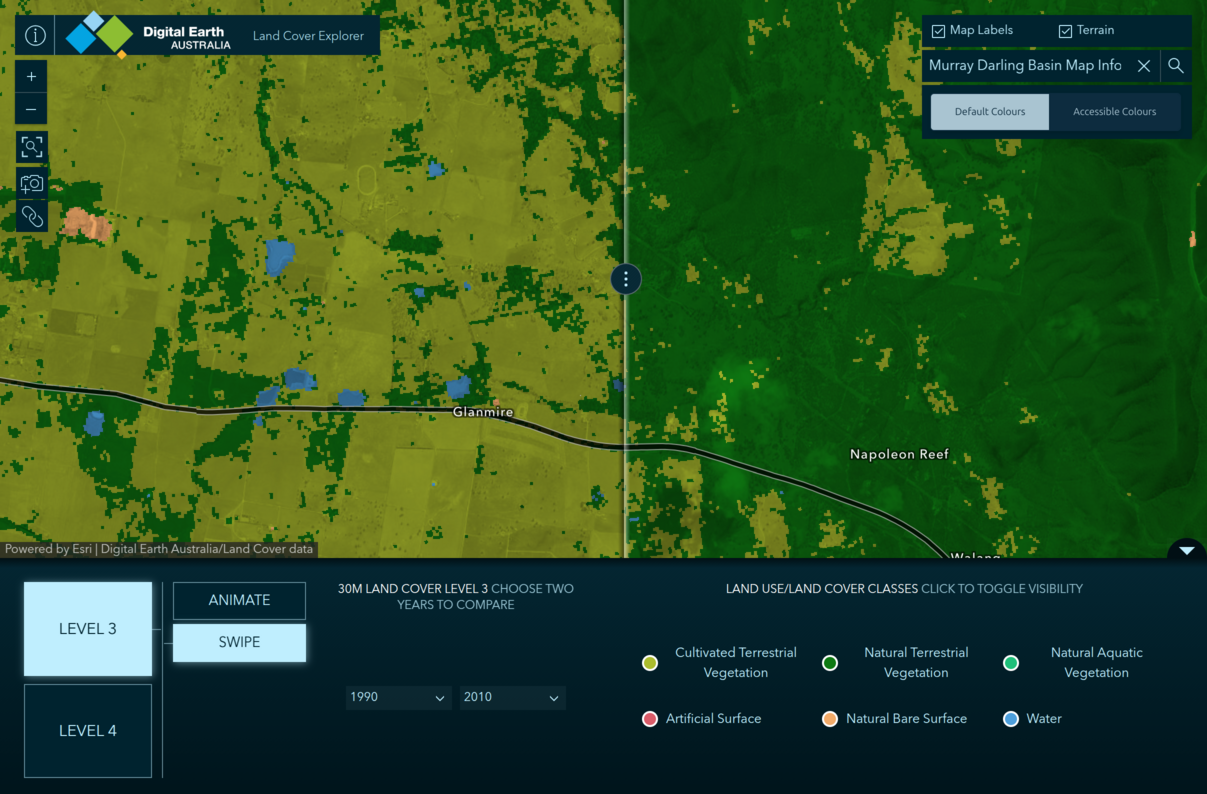
Swipe to compare two years
How to exit the ‘swipe’ view: Click the Animate option in the bottom panel.
To compare two years, follow these steps.
Ensure that Swipe is selected in the bottom panel. The map will now be divided into two sides.
You can now select two years using the Choose two years to compare section in the bottom panel, for example: ‘1990’ and ‘2010’.
The left side of the map will now display 1990 data and the right side will display 2010 data.
You can drag the divider to easily see the difference between the two years.
To exit the ‘swipe’ view, click the Animate option in the bottom panel.
Other useful features
Save this map view as an image — This button is on the left side of the page. This will save the current map view as an image to your computer.
Copy link to this app in its current state — This button is on the left side of the page. This will copy a URL to the clipboard of the map in its current state. Anyone who opens this URL will see the map in the same state, with the same configurations, viewing location, and year. You can send this URL to others, link to it from a public website, or bookmark it for later. (Note: This feature doesn’t currently save your selection of Land Cover classes.)
Accessible colours — This button is on the right side of the page. This will change the colour scheme of the map to increase contrast. This may be useful for people who have difficulty distinguishing colours.
About this app — This button (ⓘ) is at the top left of the page. It provides you with more information about this web application and its data.