2024 Q3: DEA Quarterly Validation Report
Executive Summary
This Quarterly report summarises validation for DEA surface reflectance products for Quarter 3 (July-September) of 2024 and presents aggregate validation results to the end of this quarter.
During this quarter, a total of 9 measurements were taken across 6 field sites, to capture 11 overpasses.
Validation of Landsat 8 and Sentinel-2A all improved in accuracy, taking into account the data from this quarter.
Validation of Landsat 9 and Sentinel-2B degraded slightly, which is likely because the only site measurement matched to a Sentinel-2B overpass was over a challenging site with complex terrain and surface morphology.
On an averaged band-by-band basis, Landsat 8 is validated to 2.5%, Landsat 9 is validated to 17.0%, Sentinel-2A is validated to 2.6% and Sentinel-2B is validated to 4.0%.
Introduction
This quarterly report presents a summary of results from Q3 2024 from the Digital Earth Calibration/Validation team. The report is presented in the following sections:
Background — this section outlines the context around this work, with particular attention paid ton historical work leading up to this quarter.
Summary of Validation Work — this section provides an overall view of the field site measurements undertaken.
Comments on Individual Sites of Interest — this section focuses on any sites where some aspect of the site or measurement was atypical.
Summary of Band-by-Band Matching — this section presents comparison data for this quarter’s results, in the context of all previous results.
Comments on How This Quarter’s Work Has Affected Combined Validation Results — this section discusses how the average results for each sensor have changed with the introduction of new validation data this quarter. All band data for each platform is combined to show averaged validation results.
The Q3 2024 validation report includes field site measurements that were captured as part of the winter transect work across South Australia and New South Wales. Note that one field site measurement for SA1 is part of the Q2 2024 validation report and not shown here. No other field site measurements were conducted during this quarter.
Background
The Digital Earth branch within Geoscience Australia offers a suite of Earth observation products, based on data from both Landsat and Sentinel platforms. The core products are Landsat 8 and 9 and Sentinel-2A and -2B surface reflectance (SR). To deliver these products with confidence, the Calibration/Validation team perform vicarious validation by measuring field sites with hand-held equipment or an Unstaffed Aerial Vehicle (UAV; commonly known as drone) equipment close to the time of an overpass. This work began with Phase 1, where measurements were performed by multiple groups across continental Australia. Full details on the results and methodology can be found in the Phase 1 report.
Data for both SR products and from field site measurements are made freely available. For SR products, you can visualise the data in DEA Maps, or for a more in-depth understanding and direct access to data, please visit the DEA Knowledge Hub Data Products section. Field measurement data are made available through the National Spectral Database.
As more field sites are measured and as newer measurements are made over the same field sites, the overall validation of SR products becomes more accurate. The purpose of this report is to provide an up-to-date status of validation accuracy, based on the most recent measurements.
Summary of Validation Work
6 sites were measured, with 9 individual field site captures. The Table below summarises these captures.
Site capture (Date, Field site, Overpasses) |
Latitude, Longitude (WGS84) |
Instrument |
Comments |
|---|---|---|---|
-31.81348, 142.10368 |
Hand-held ASD FR-4 |
Both satellites affected by cloud – validation data not used. |
|
-31.59525, 143.48095 |
Drone mounted SR-3500 |
Good matchup |
|
-31.52124, 145.47855 |
Hand-held ASD FR-4 |
Good matchup |
|
-31.52124, 145.47862 |
Hand-held ASD FR-4 |
Good matchup |
|
-31.52760, 146.97750 |
Drone mounted SR-3500 |
Good matchup |
|
-32.20980, 148.21046 |
Hand-held ASD FR-4 |
Good matchup |
|
-32.20982, 148.21043 |
Hand-held ASD FR-4 |
Good matchup |
|
-30.78773, 150.02628 |
Drone mounted SR-3500 |
Clouds nearby for S-2B overpass but both overpasses show a good matchup. Field site shows a significant slope and is partially over tree canopy. |
|
-30.78777, 150.02628 |
Drone mounted SR-3500 |
Good matchup. Field site shows a significant slope and is partially over tree canopy. |
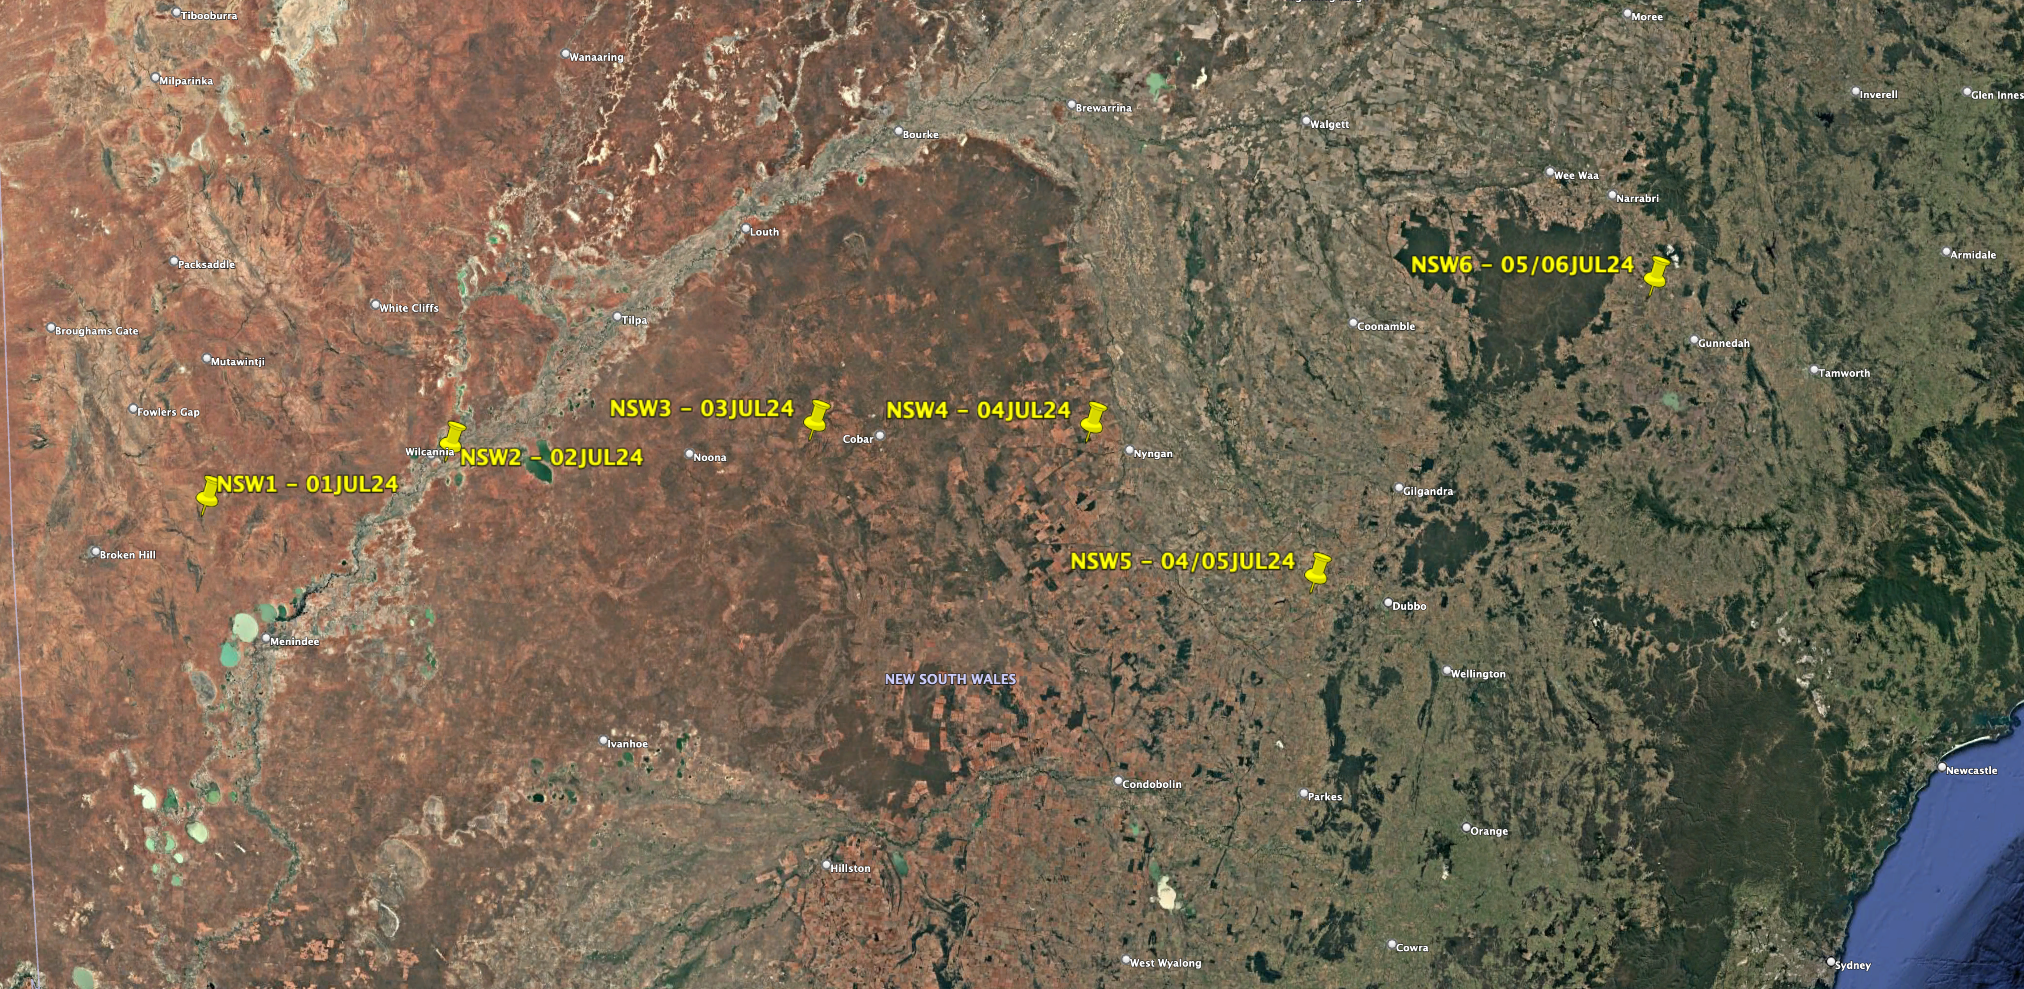
The Figure shows the locations of the field sites measured in this quarter.
Summary of Band-by-Band Matching
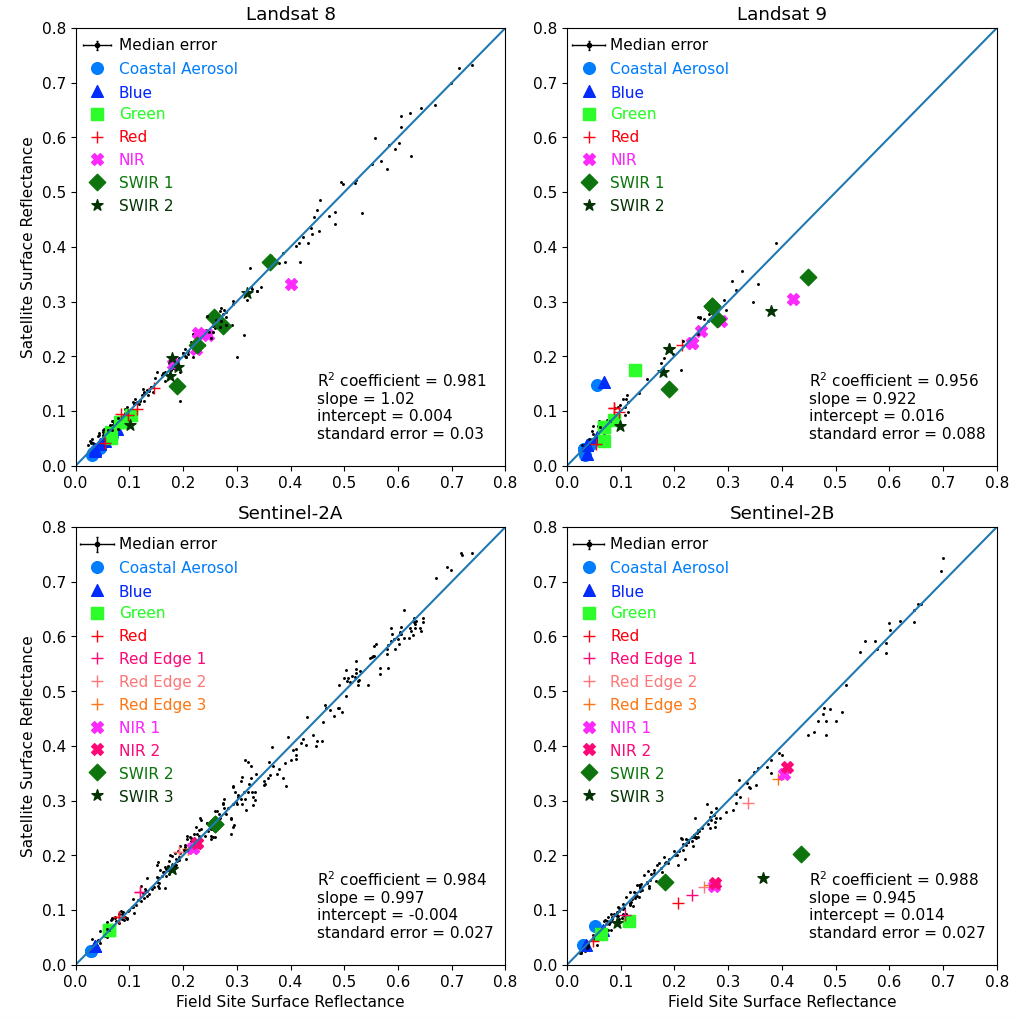
The Figure shows comparison data for each platform. Black dots represent data that were collected prior to this quarter. Coloured symbols represent data that were collected in this quarter. The diagonal line in each panel shows the one-to-one correspondence between field and satellite data. Note that this diagonal line does NOT show the line of best fit. It is plotted this way to highlight any trends where the data may be biased away from the line of one-to-one correspondence. The statistics in the bottom-right corner of each panel provide details for the line of best fit through all points up to and including this quarter’s data.
The Table below lists overall validation results. These are based on the standard deviation of the scatter that we find for each band of each sensor. This is when taking all the validation results together, up to and including this quarter’s results. The band-by-band scatter is representative of the validation performance of each band. Rather than providing values for each individual band, we characterise all results by looking at the mean and maximum scatter for each platform.
Satellite platform |
Mean band-by-band scatter |
Maximum band-by-band scatter |
|---|---|---|
Landsat 8 |
2.5% |
3.5% |
Landsat 9 |
17.0% |
42.3% |
Sentinel-2A |
2.6% |
3.5% |
Sentinel-2B |
4.0% |
10.2% |
For example, the Table shows that each Landsat 8 band is typically validated to 2-3%, with the worst performance of a band being 3.5%. Note that there is much larger scatter for Landsat 9, indicating higher uncertainty in validation. This is because there have been fewer field site measurements to coincide with the relatively new Landsat 9 platform.
Effect on Cumulative Validation Results
This section discusses the effect that this quarter’s validation results have had on the total validation results over all time.
For Landsat 8, this quarter has seen an overall improvement in validation results. There were 5 field site comparison measurements. The NIR band for NSW6 on 6 July, 2024 stands out as below the line of equality. This is the Boggabri field site, where there is a significant slope to the site, as well as strongly changing surface reflectance (SR) within the field site. A BRDF correction to the slope has not yet been applied to the SR-3500 data (expected to be done in Q1, 2025), which may also contribute to the discrepancy. Overall, the field data for Landsat 8 overpasses continue to improve the validation reliability, where the statistics indicate that, with all bands taken together, Landsat 8 data can be relied upon to around 1% of the SR.
For Landsat 9, this quarter has seen an overall improvement in validation results. There were 4 field site comparison measurements. Again, the NIR band for NSW6 on 5 July, 2024 stands out as below the line of equality. This is the Boggabri field site, where there is a significant slope to the site, as well as strongly changing SR within the field site. A BRDF correction to the slope has not yet been applied to the data, which may also contribute to the discrepancy. Overall, the field data for Landsat 9 overpasses continue to improve the validation reliability, where the statistics indicate that, with all bands taken together, Landsat 9 data can be relied upon to around 2% of the SR. The larger uncertainty of Landsat 9, when compared to Landsat 8 above, is most likely due to few overall field site comparisons with the newer Landsat 9 OLI2 sensor.
For Sentinel-2A, this quarter has seen an overall improvement in validation results. There was 1 field site comparison measurement at NSW3 on 3 July, 2024. This measurement shows an excellent match. Overall, the field data for Sentinel-2A overpasses continue to improve the validation reliability, where the statistics indicate that, with all bands taken together, Sentinel-2A data are consistently within around 1% of the SR.
For Sentinel-2B, this quarter has seen an overall degradation in validation results. There was 1 field site comparison measurement at NSW6 on 5 July, 2024. This measurement is the Boggabri field site, where there is a significant slope to the site, as well as strongly changing SR within the field site. A BRDF correction to the slope has not yet been applied to the data, which may also contribute to the discrepancy. Overall, the field data for Sentinel-2B in this quarter has slightly degraded validation performance, where the statistics indicate that, with all bands taken together, Sentinel-2B data can be relied upon to around 1% of the SR.
Fractional Cover Validation
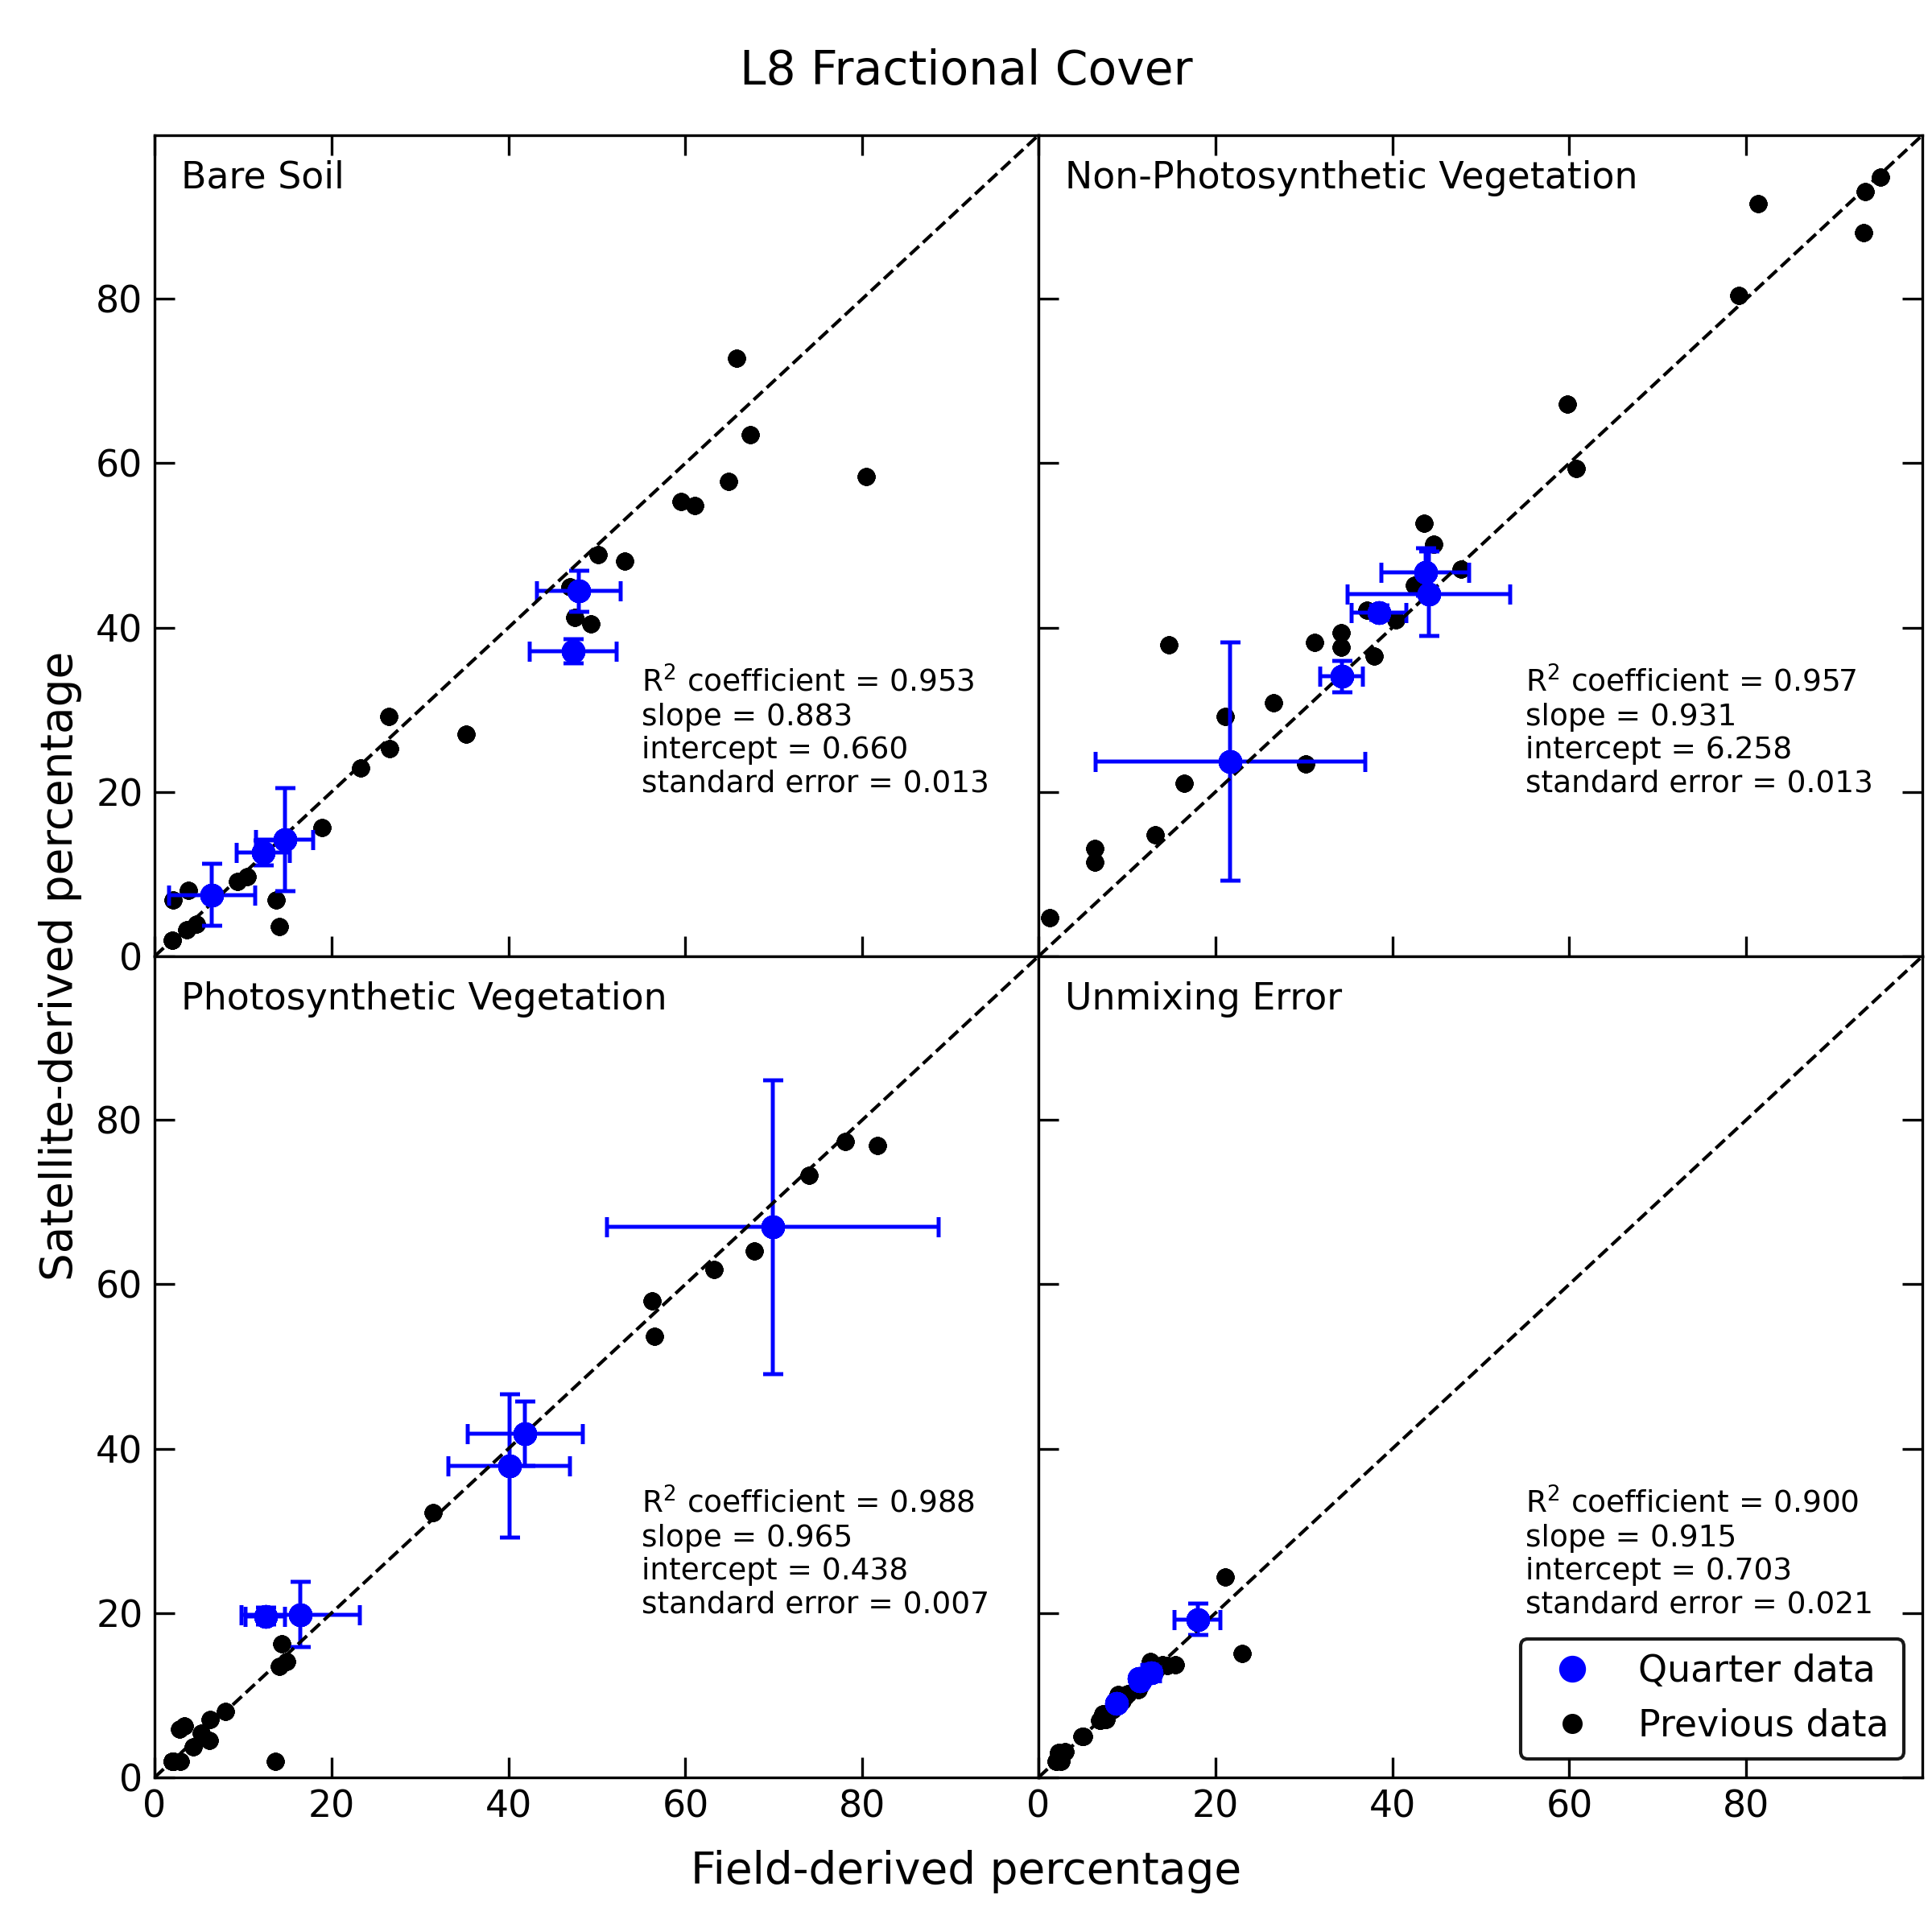
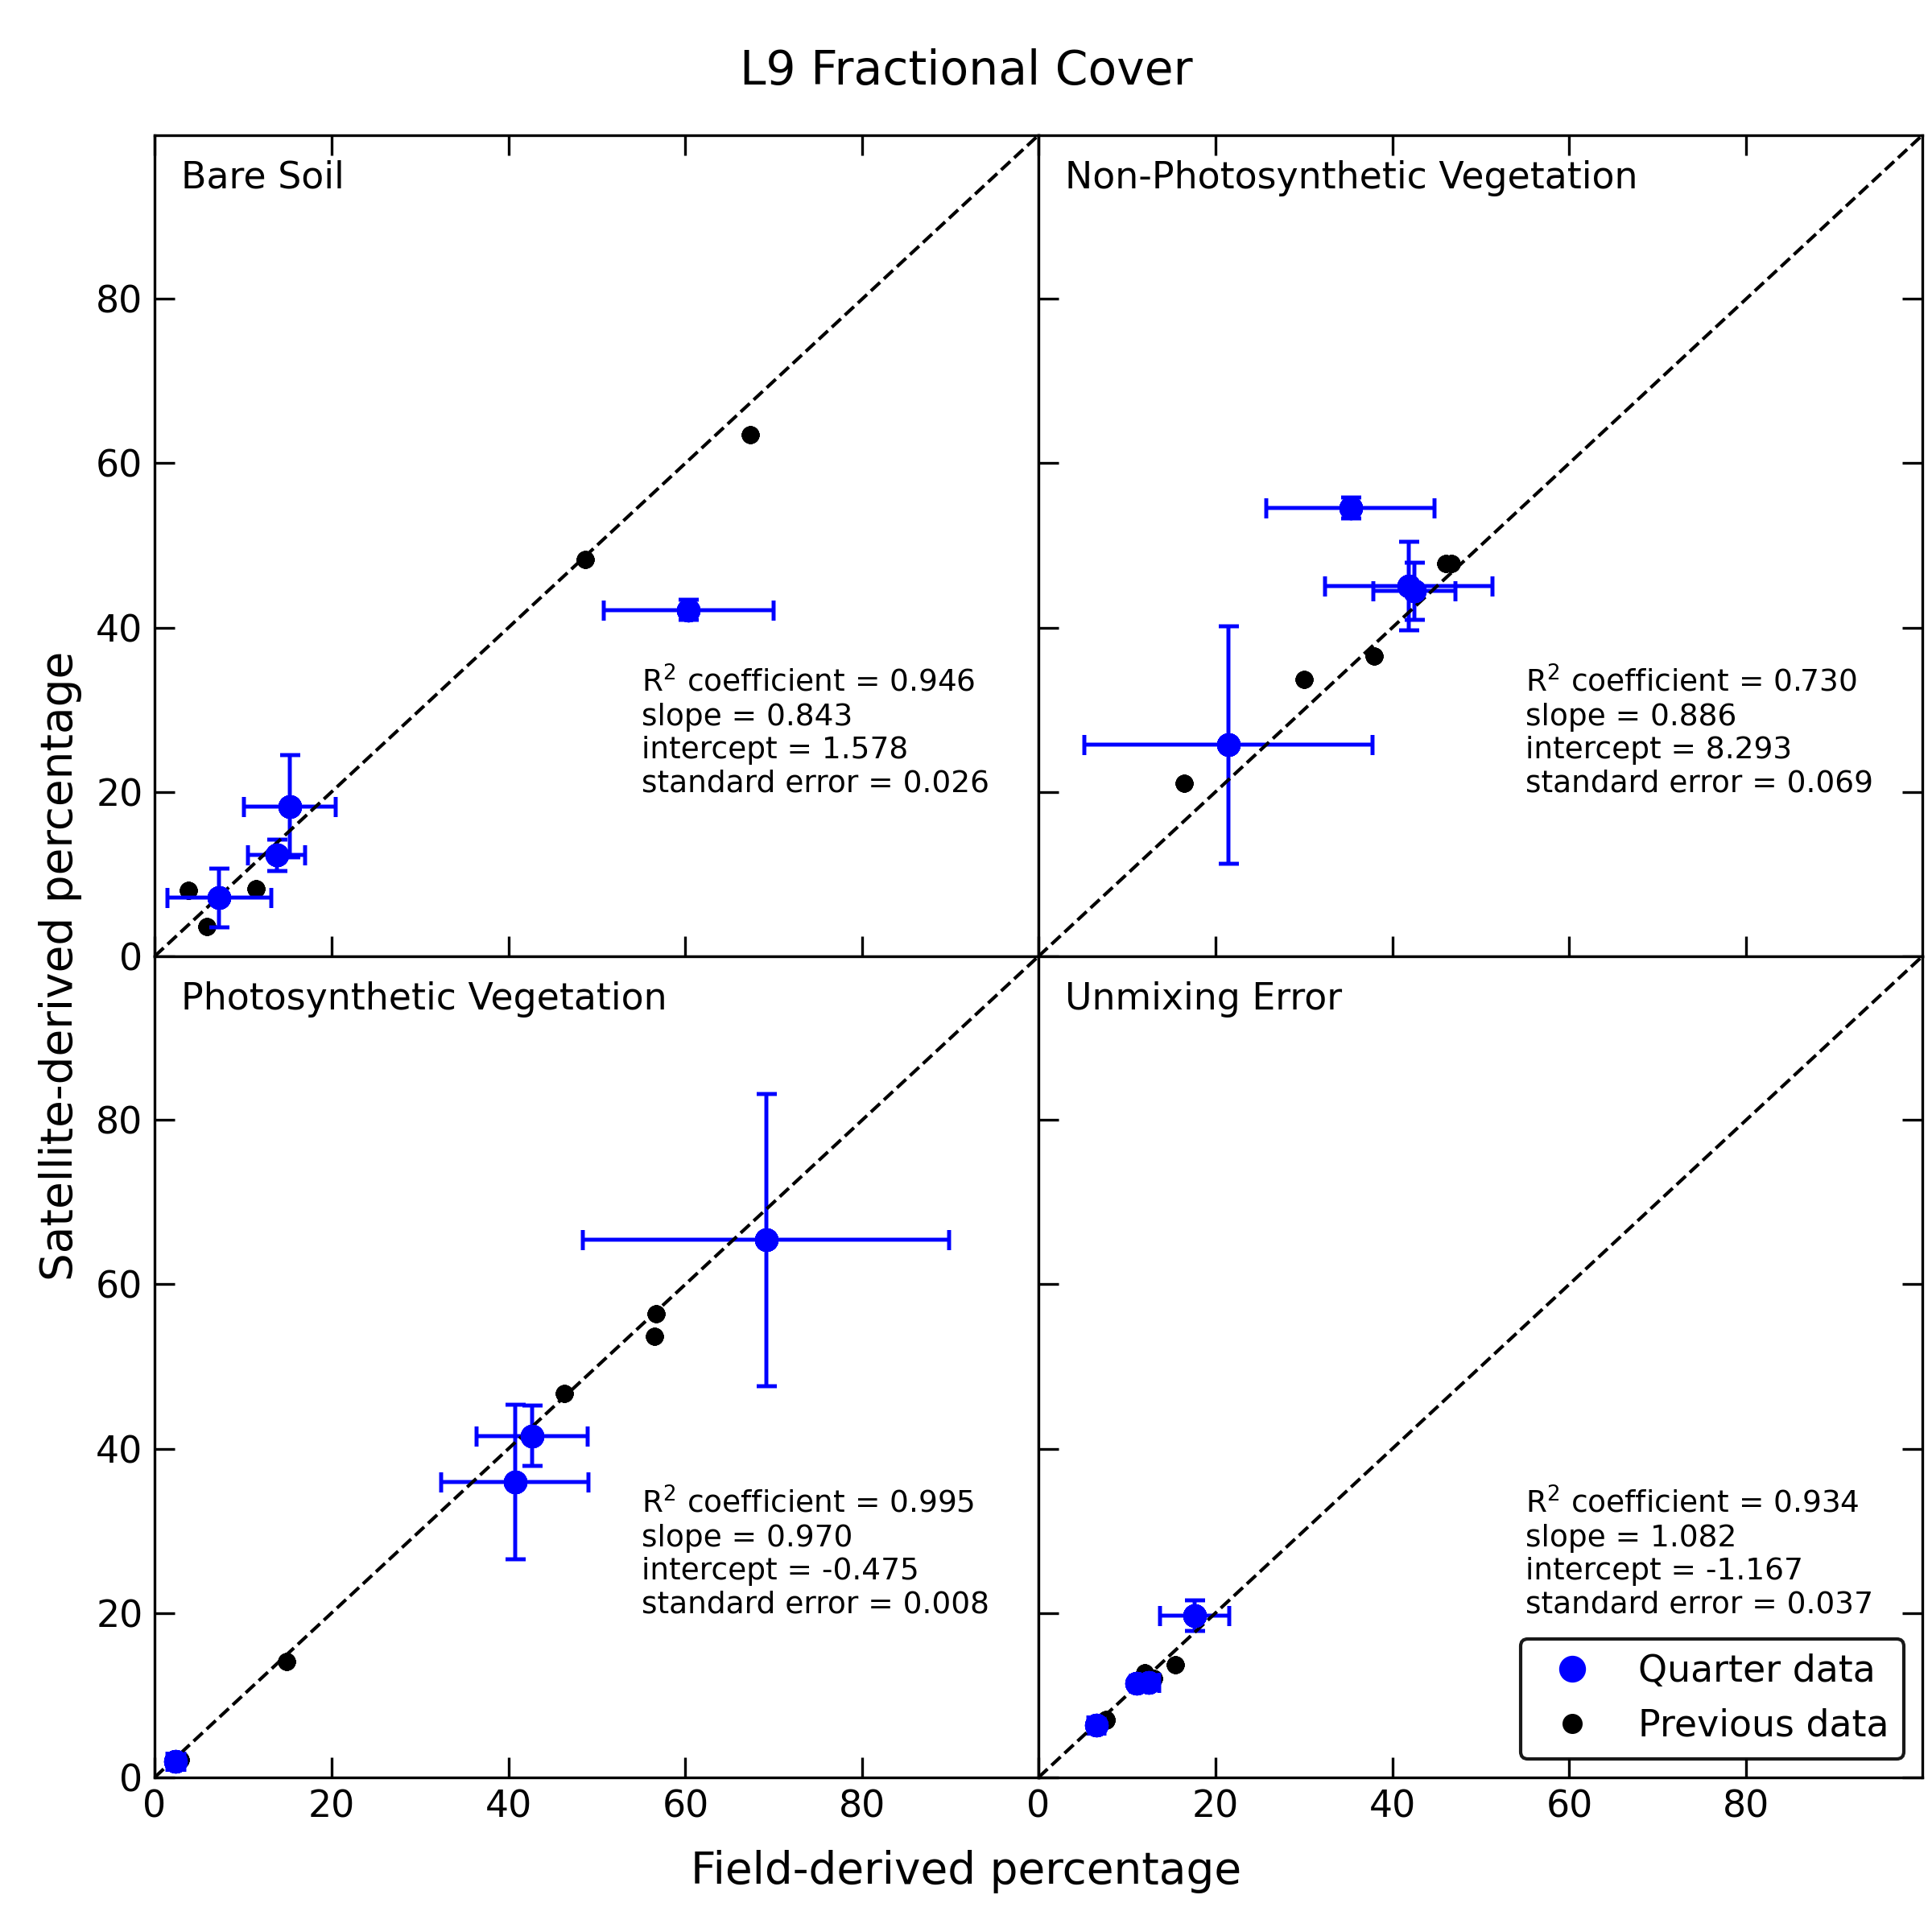
The above Figures show a comparison of this Quarter’s validation data (shown in blue) vs. previous data (black) for Landsat 8 and 9. The diagonal dashed lines show the one-to-one correspondence and NOT the line of best fit between the points. The line of best fit is represented by the parameters shown in the bottom-right of each panel, including \(R^2\) correlation coefficient, slope, intercept and standard deviation. Blue points, which include data for this Quarter, also show uncertainty error bars. Black dots represent data that were collected prior to this Quarter. For each Figure, panels show the four Fractional Cover (FC) parameters: Bare Soil (BS, top-left), Non-Photosynthetic Vegetation (NPV, top-right), Photosynthetic Vegetation (PV, bottom-left) and Unmixing Error (UE, bottom-right).
Note that the Fractional Cover (FC) comparison does not compare results with a ‘ground truth’, but is a comparison of derived FC parameters based on satellite SR (vertical axis) and field SR (horizontal axis).
Acknowledgments
The field validation data were collected by Geoscience Australia.
Comments on Individual Sites of Interest
NSW6 field site, also known as Boggabri, is situated on the slope of a hill, which rises about 200m over a length of around 700m. The bottom of the hill is situated within a canola field, However, the field site is located along the slope of the hill, which is covered with native vegetation, mainly comprising of trees. This site was specifically selected to be more challenging than typical field sites due to the slope of the hill and the presence of the tree canopy.
The Figure shows NSW6 field site (blue square), in the context of the surrounding area. The bottom panel of the Figure shows the elevation profile of the hill, following along the white line drawn in the upper panel.