2025 Q2: DEA Quarterly Validation Report
Executive Summary
This Quarterly report summarises validation for DEA surface reflectance products for Quarter 2 (April-June) of 2025 and presents aggregate validation results to the end of this quarter.
During this quarter, a total of 14 measurements were taken across 10 field sites, to capture 17 overpasses.
Prior to this Quarter, the Sentinel-2C product was introduced and the Sentinel-2A product was archived, so validation efforts for Sentinel now focus on -2B and -2C.
Validation of all satellites improved over this time.
On an averaged band-by-band basis, Landsat 8 is validated to 2.4%, Landsat 9 is validated to 7.3%, Sentinel-2B is validated to 3.8% and Sentinel-2C is validated to 17.4%.
Introduction
This quarterly report presents a summary of results from Q2 2025 from the Digital Earth Calibration/Validation team. The report is presented in the following sections:
Background — this section outlines the context around this work, with particular attention paid ton historical work leading up to this quarter.
Summary of Validation Work — this section provides an overall view of the field site measurements undertaken.
Comments on Individual Sites of Interest — this section focuses on any sites where some aspect of the site or measurement was atypical.
Summary of Band-by-Band Matching — this section presents comparison data for this quarter’s results, in the context of all previous results.
Comments on How This Quarter’s Work Has Affected Combined Validation Results — this section discusses how the average results for each sensor have changed with the introduction of new validation data this quarter. All band data for each platform is combined to show averaged validation results.
Background
The Digital Earth branch within Geoscience Australia offers a suite of Earth observation products, based on data from both Landsat and Sentinel platforms. The core products are Landsat 8 and 9 and Sentinel-2B and -2C surface reflectance (SR). To deliver these products with confidence, the Calibration/Validation team perform vicarious validation by measuring field sites with hand-held equipment or an Unstaffed Aerial Vehicle (UAV; commonly known as drone) equipment close to the time of an overpass. This work began with Phase 1, where measurements were performed by multiple groups across continental Australia. Full details on the results and methodology can be found in the Phase 1 report.
Data for both SR products and from field site measurements are made freely available. For SR products, you can visualise the data in DEA Maps, or for a more in-depth understanding and direct access to data, please visit the DEA Knowledge Hub Data Products section. Field measurement data are made available through the National Spectral Database.
As more field sites are measured and as newer measurements are made over the same field sites, the overall validation of SR products becomes more accurate. The purpose of this report is to provide an up-to-date status of validation accuracy, based on the most recent measurements.
Summary of Validation Work
10 sites were measured, with 13 individual field site captures. The Table below summarises these captures.
Site capture (Date, Field site, Overpasses) |
Latitude, Longitude (WGS84) |
Instrument |
Comments |
|---|---|---|---|
-35.122747, 148.862612 |
Hand-held ASD FR-4 |
Both Excellent matchup |
|
-32.175474, 140.642875 |
Hand-held ASD FR-4 |
Good matchup |
|
-31.814046, 142.104200 |
Hand-held ASD FR-4 |
L9: Good matchup. S-2B: Excellent matchup |
|
-31.595985, 143.483040 |
Hand-held SR-3500 |
Excellent matchup |
|
-31.596118, 143.483167 |
Hand-held SR-3500 |
Excellent matchup |
|
-31.521335, 145.478526 |
Hand-held ASD FR-4 |
Good matchup |
|
-31.521348, 145.478564 |
Hand-held ASD FR-4 |
Good matchup |
|
-31.527130, 146.978367 |
Hand-held SR-3500 |
Good matchup |
|
-32.209699, 148.210396 |
Hand-held ASD FR-4 |
Excellent matchup |
|
-32.209718, 148.210447 |
Hand-held ASD FR-4 |
Excellent matchup |
|
-30.786570, 150.024613 |
Hand-held SR-3500 |
Both excellent matchup. Site shows significant (~15\degree) slope. |
|
-30.985918, 151.483177 |
Hand-held ASD FR-4 |
Mediocre matchup |
|
-31.083548, 153.037374 |
Hand-held ASD FR-4 and SR-3500 |
Site shows significant terrain, being sand dunes. Results not used. |
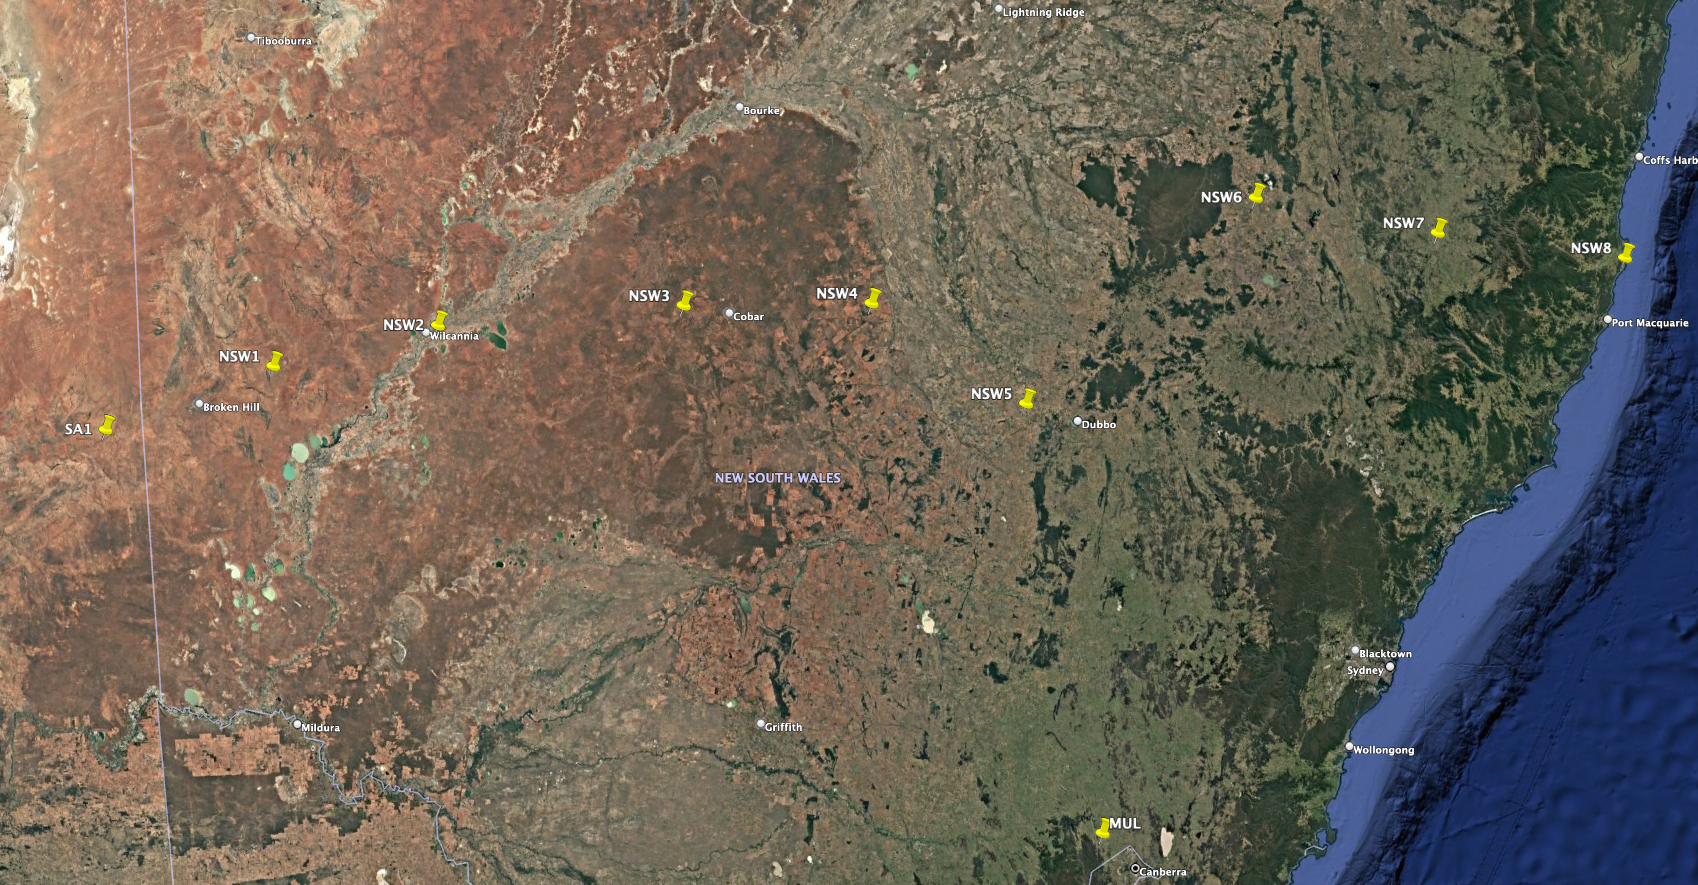
The Figure shows the locations of the field sites measured in this quarter.
Summary of Band-by-Band Matching
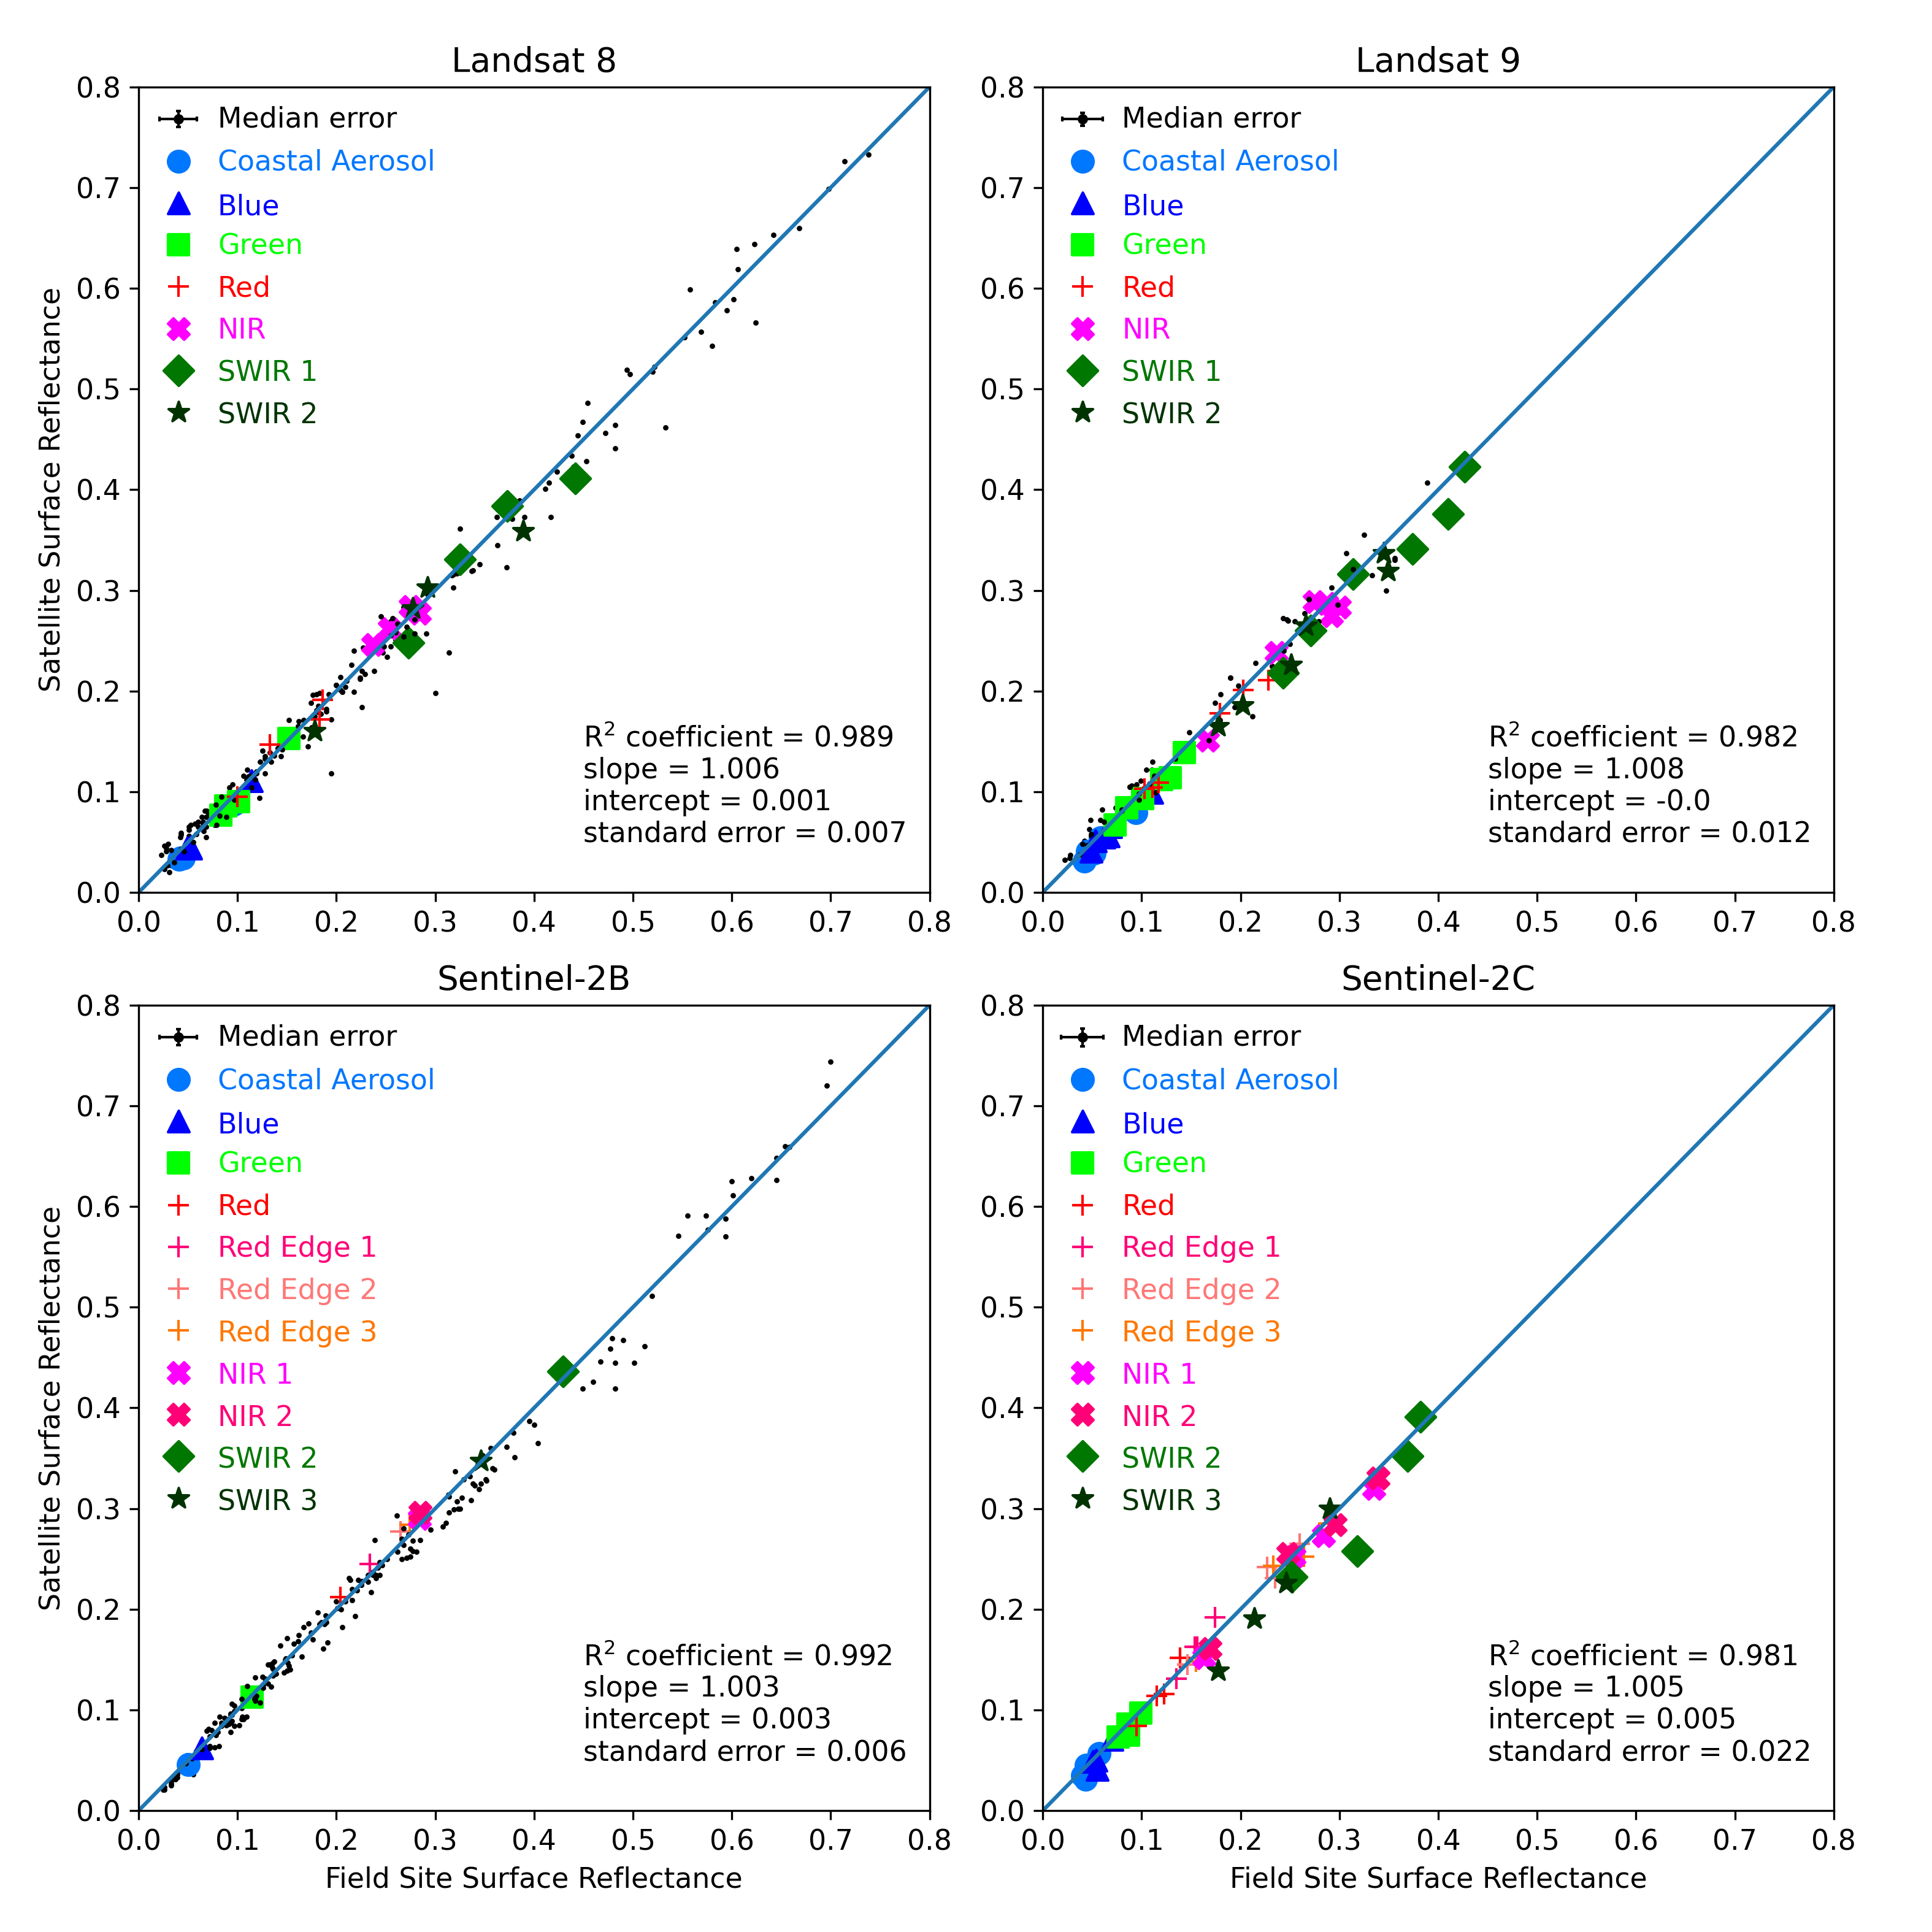
The Figure shows comparison data for each platform. Black dots represent data that were collected prior to this quarter. Coloured symbols represent data that were collected in this quarter. The diagonal line in each panel shows the one-to-one correspondence between field and satellite data. Note that this diagonal line does NOT show the line of best fit. It is plotted this way to highlight any trends where the data may be biased away from the line of one-to-one correspondence. The statistics in the bottom-right corner of each panel provide details for the line of best fit through all points up to and including this quarter’s data.
The Table below lists overall validation results. These are based on the standard deviation of the scatter that we find for each band of each sensor. This is when taking all the validation results together, up to and including this quarter’s results. The band-by-band scatter is representative of the validation performance of each band. Rather than providing values for each individual band, we characterise all results by looking at the mean and maximum scatter for each platform.
Satellite platform |
Mean band-by-band scatter |
Maximum band-by-band scatter |
|---|---|---|
Landsat 8 |
2.4% |
3.3% |
Landsat 9 |
7.3% |
11.8% |
Sentinel-2B |
3.8% |
7.9% |
Sentinel-2C |
17.4% |
38.7% |
For example, the Table shows that each Landsat 8 band is typically validated to 2.4%, with the worst performance of a band being 3.3%. Note that there is much larger scatter for Landsat 9 and Sentinel-2C, indicating higher uncertainty in validation. This is because there have been fewer field site measurements to coincide with the relatively new Landsat 9 and Sentinel-2C platforms.
Effect on Cumulative Validation Results
This section discusses the effect that this quarter’s validation results have had on the total validation results over all time.
For Landsat 8, this quarter has seen an overall improvement in validation results. There were 4 field site comparison measurements. Overall, the field data for Landsat 8 overpasses continues to improve the validation reliability.
For Landsat 9, this quarter has seen an overall improvement in validation results. There were 6 field site comparison measurements. Overall, the field data for Landsat 9 overpasses continue to improve the validation reliability.
For Sentinel-2B, this quarter has seen an overall improvement in validation results. There was 1 field site comparison measurement. Overall, the field data for Sentinel-2B overpasses continue to improve the validation reliability.
For Sentinel-2C, this quarter has seen the first validation results. There were 4 field site comparison measurements.
Fractional Cover Validation
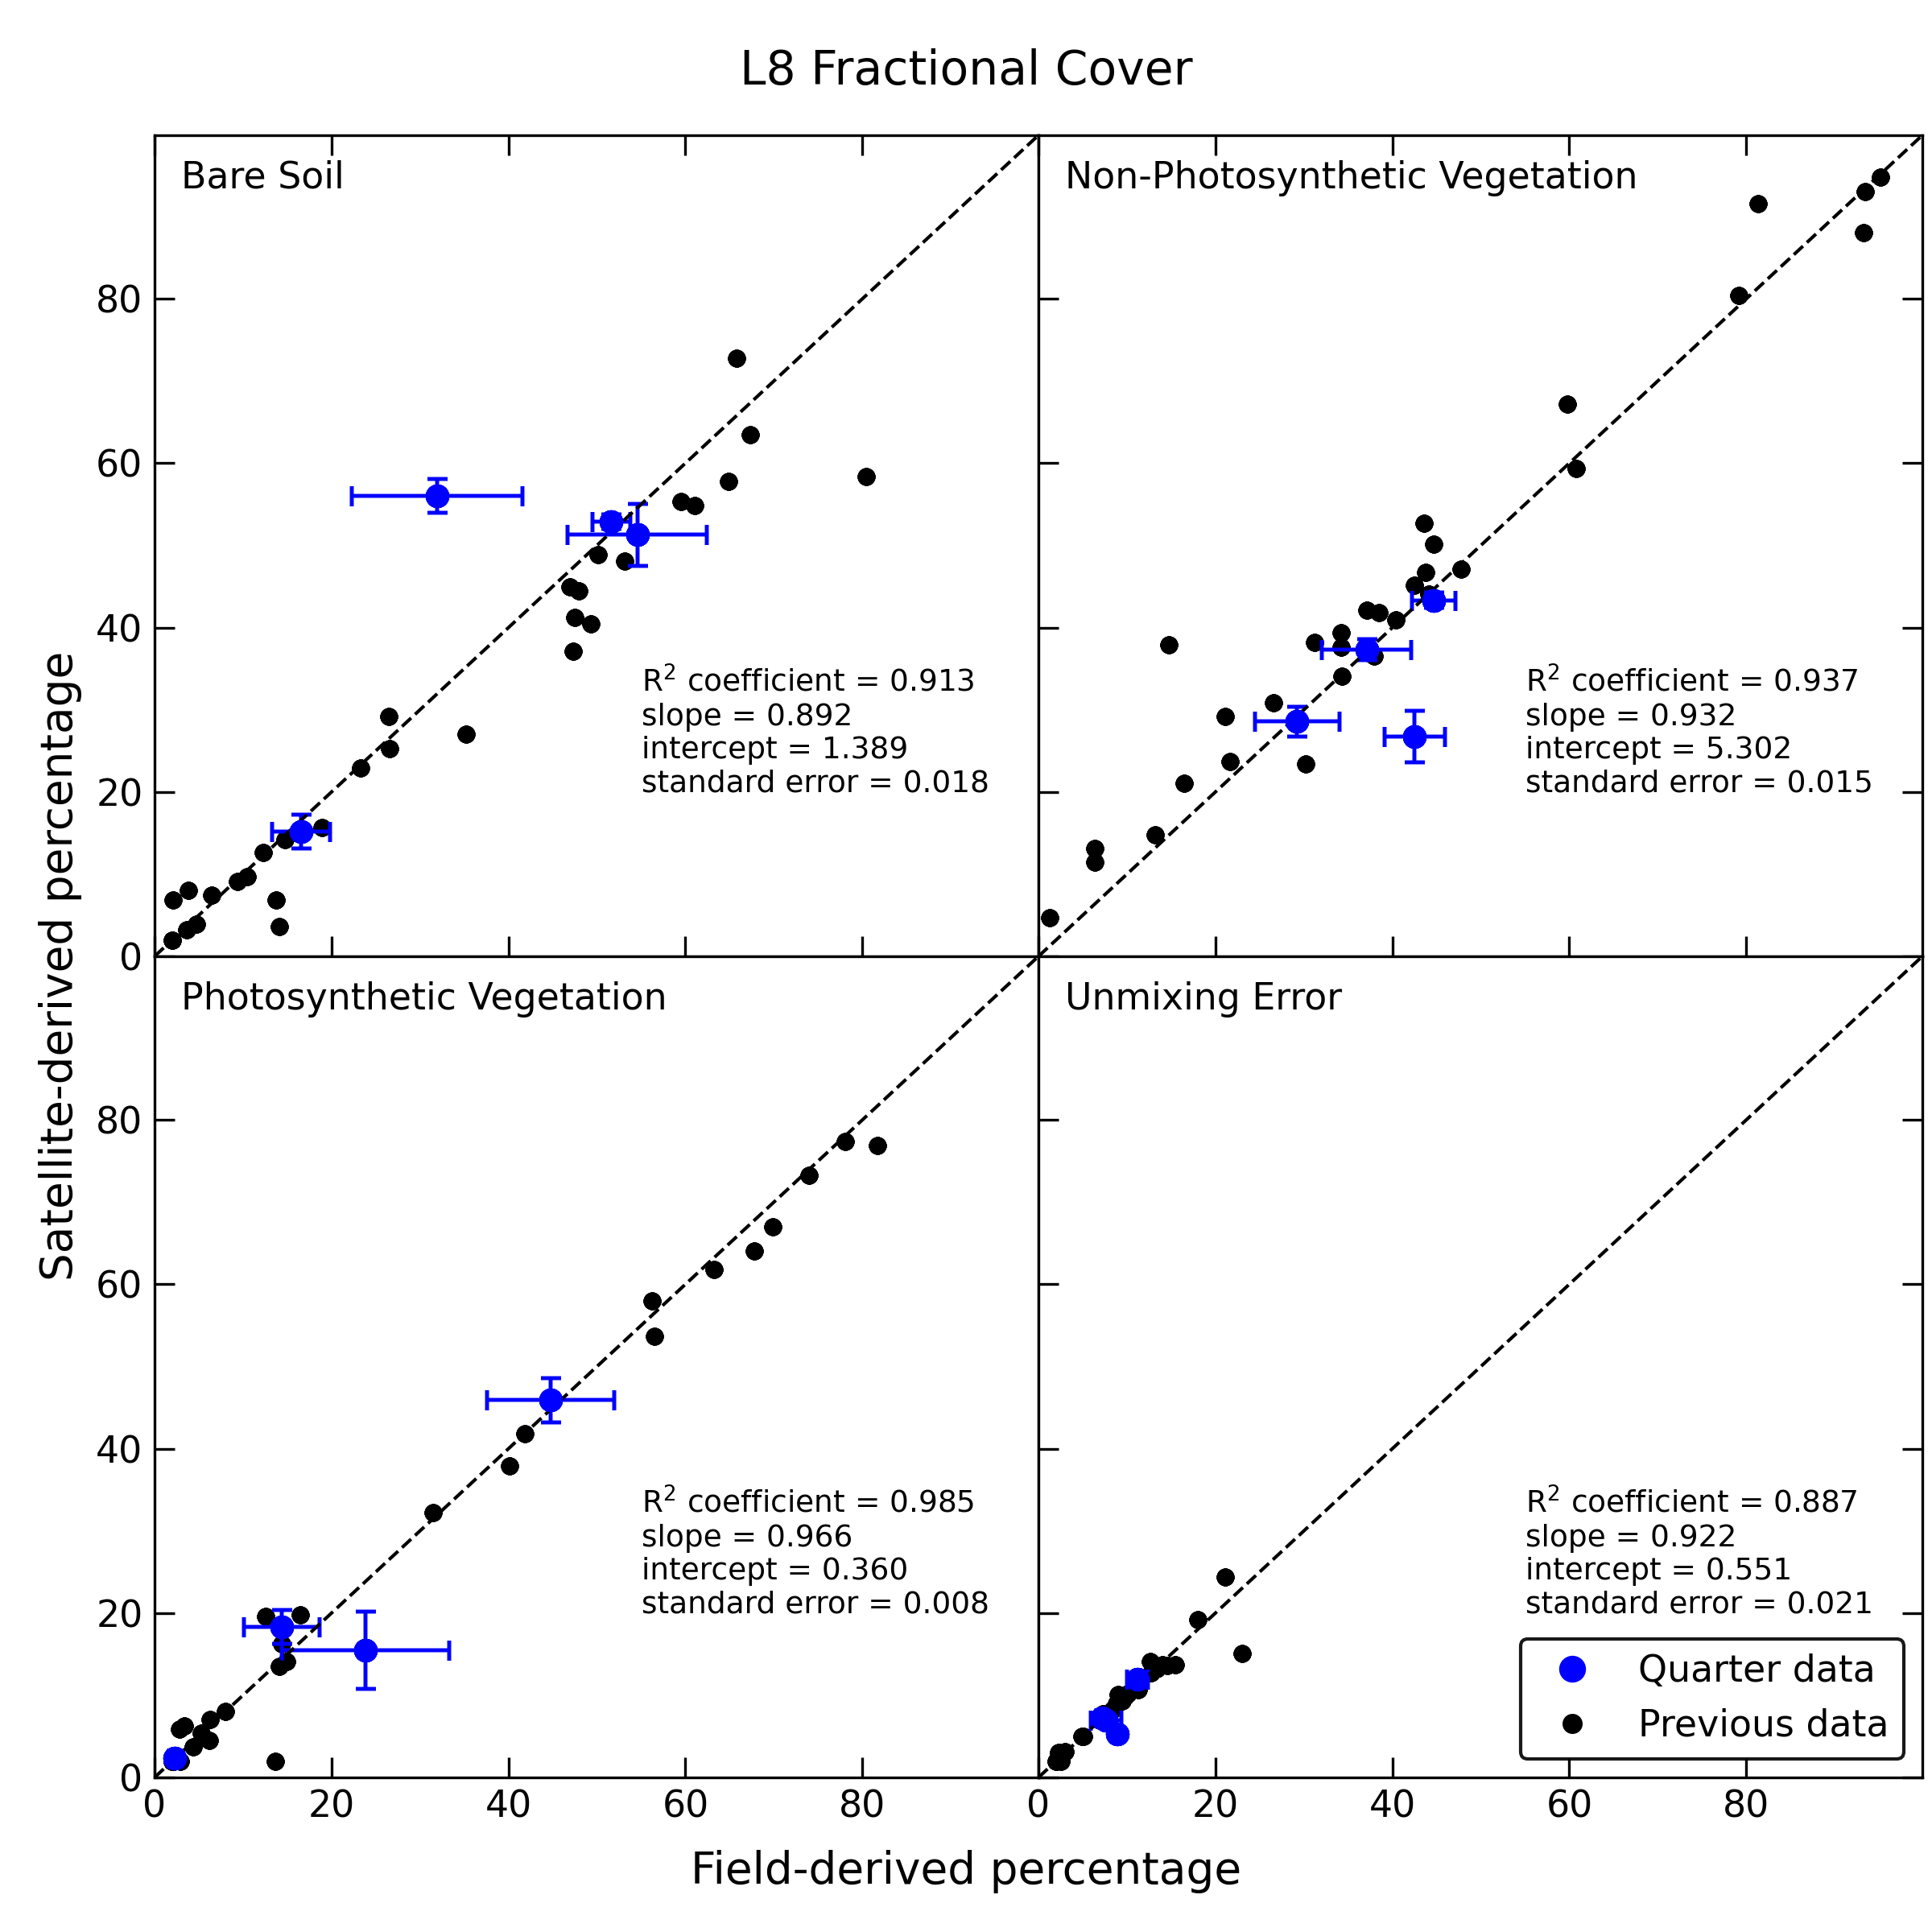
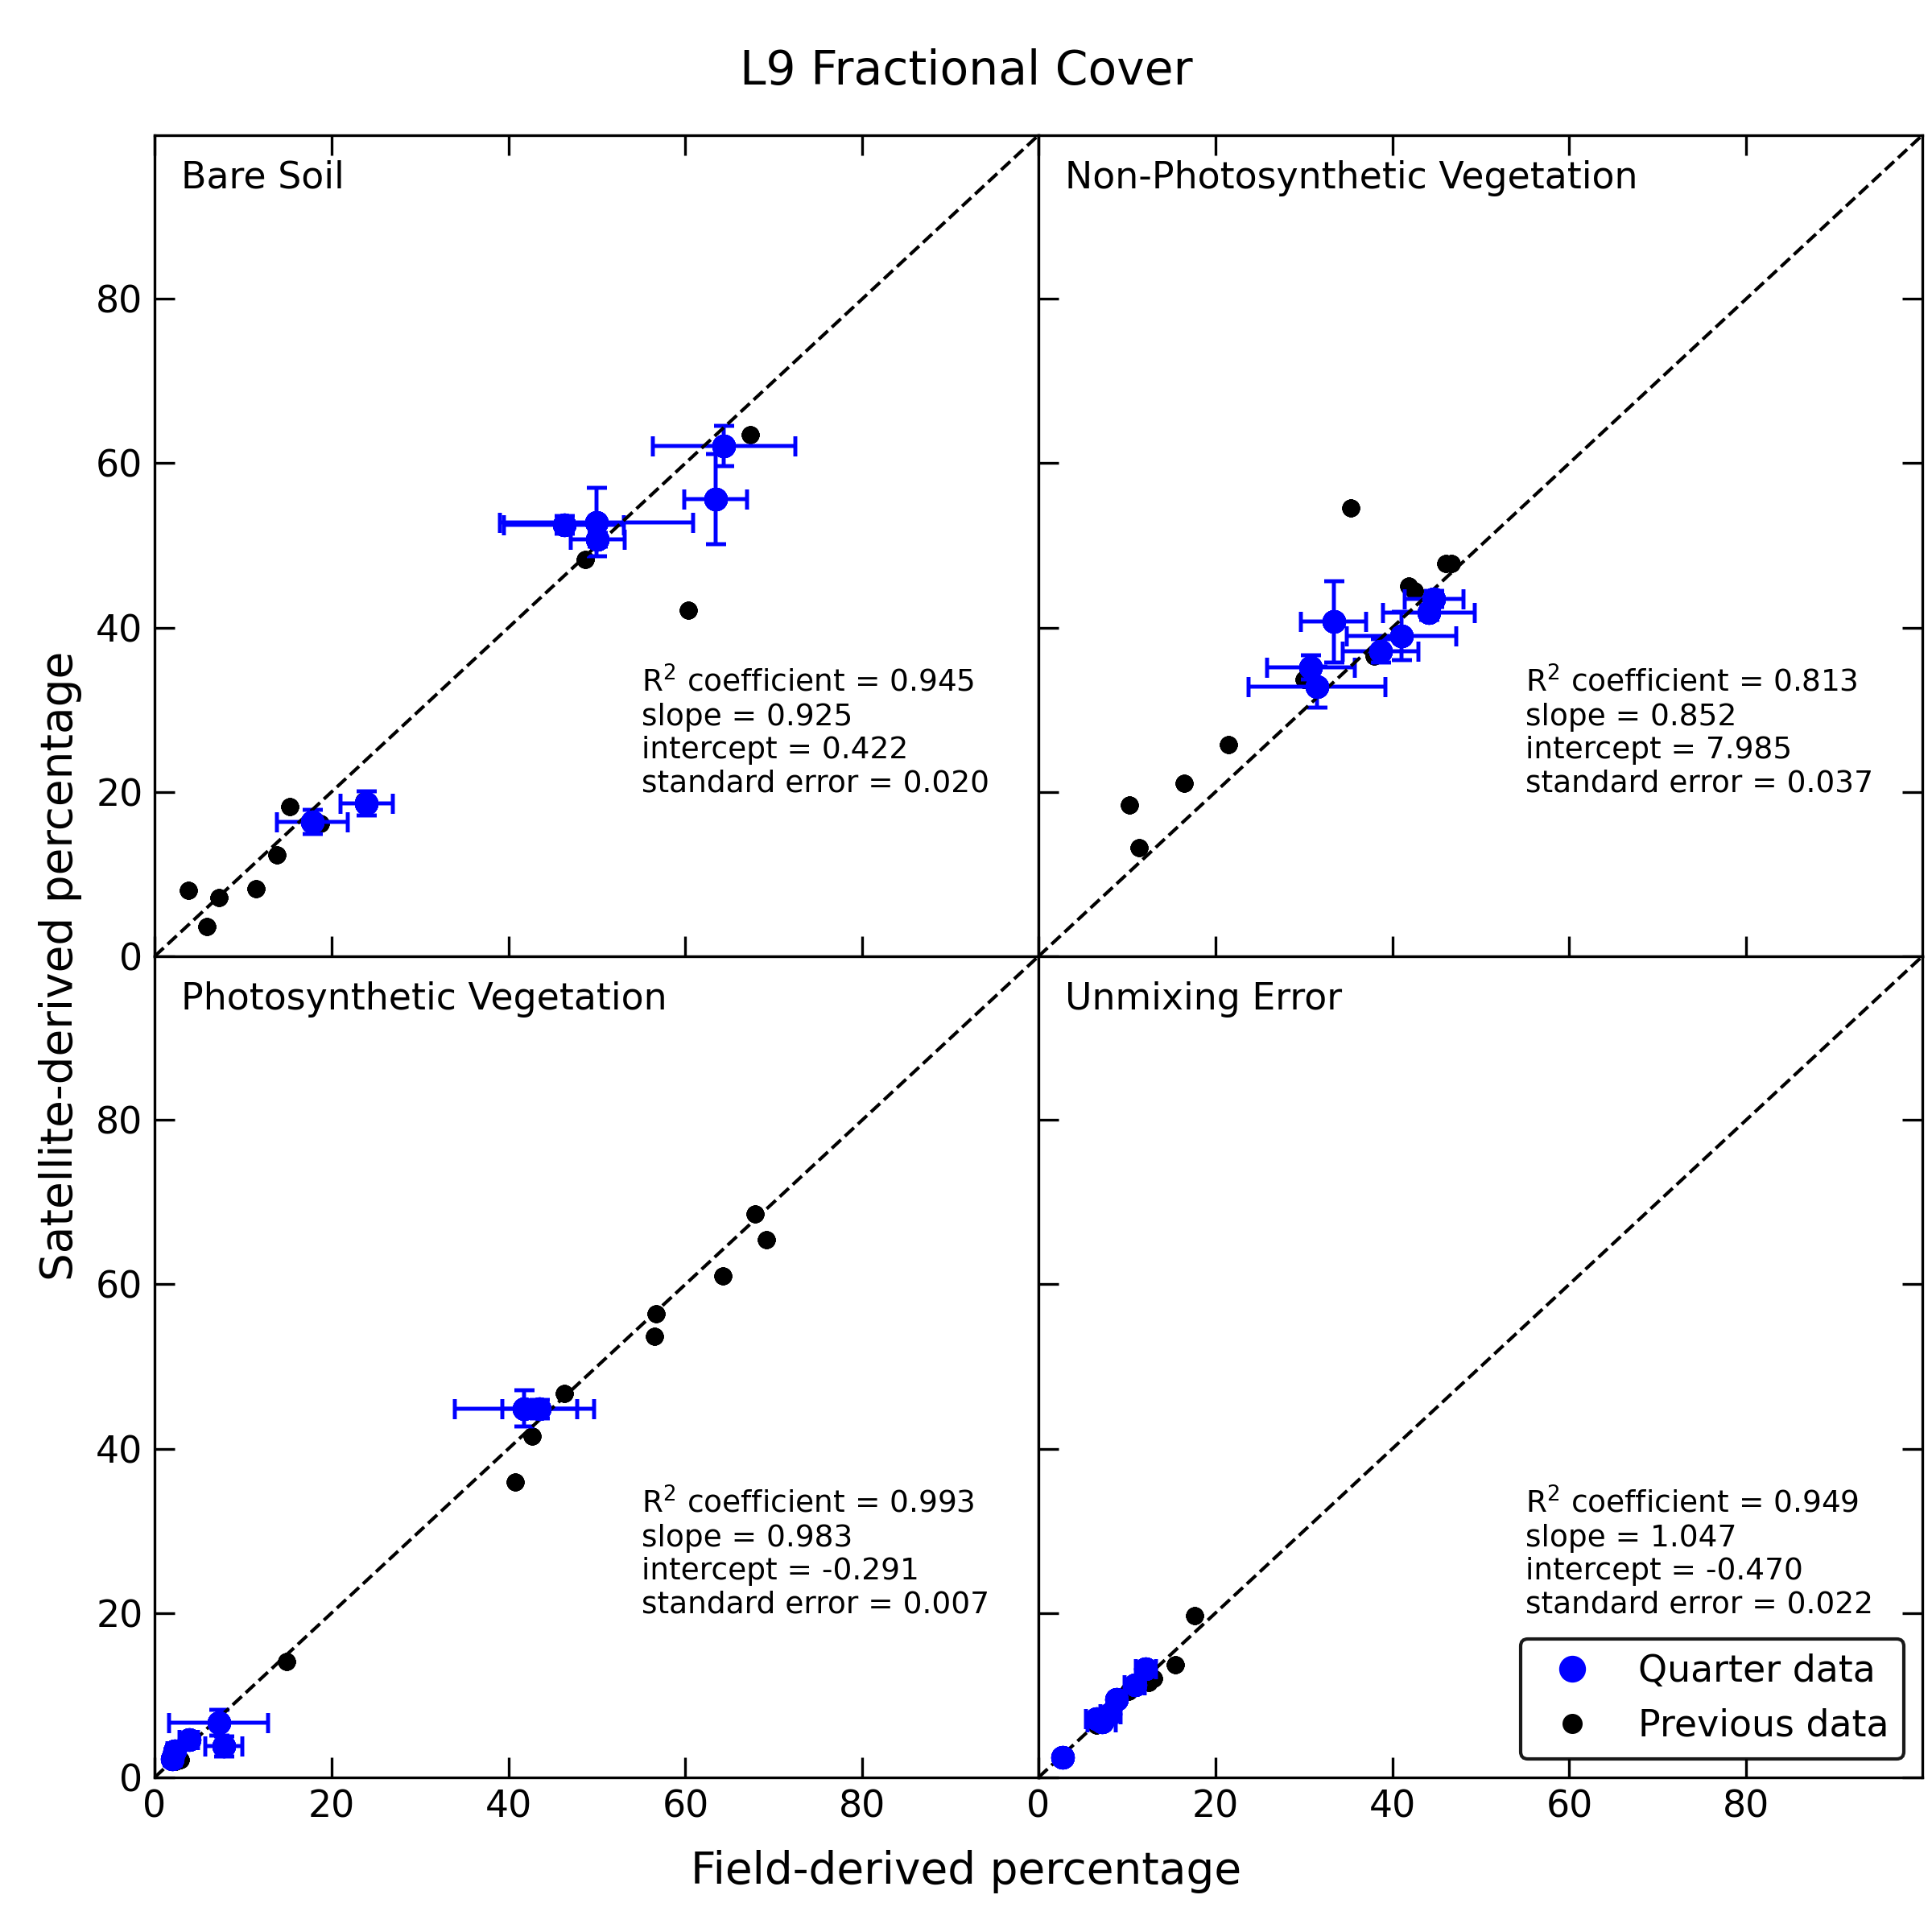
The above Figures show a comparison of this Quarter’s validation data (shown in blue) vs. previous data (black) for Landsat 8 and 9. The diagonal dashed lines show the one-to-one correspondence and NOT the line of best fit between the points. The line of best fit is represented by the parameters shown in the bottom-right of each panel, including \(R^2\) correlation coefficient, slope, intercept and standard deviation. Blue points, which include data for this Quarter, also show uncertainty error bars. Black dots represent data that were collected prior to this Quarter. For each Figure, panels show the four Fractional Cover (FC) parameters: Bare Soil (BS, top-left), Non-Photosynthetic Vegetation (NPV, top-right), Photosynthetic Vegetation (PV, bottom-left) and Unmixing Error (UE, bottom-right).
Note that the Fractional Cover (FC) comparison does not compare results with a ‘ground truth’, but is a comparison of derived FC parameters based on satellite SR (vertical axis) and field SR (horizontal axis).
Acknowledgments
The field validation data were collected by Geoscience Australia.
Comments on Individual Sites of Interest
NSW6 field site, also known as Boggabri or Mt Binnalong is on the slope of a hill, as demonstrated this time last year. LiDAR mapping of the site indicated that the terrain could be characterised by a single slope of 15 degrees, in the direction of 45 degrees, east of north. This information was used to adjust the BRDF correction for the ground data. This method proved successful, with excellent matchups for this field site. It should be noted that the error bars on the ground measurements are unusually high for this site. This is expected to be because the ground is rocky in nature, with many angled surfaces and shadowed ground. Such features are smoothed out on the scale of Landsat or Sentinel imagery, but can affect the ground-based data.
NSW8 field site, also known as Hat Head is situated on sand dunes, with significant terrain change across the site. In 2023, the LiDAR was flown over the site to give a Digital Surface Model, as shown below. An unsuccessful attempt was made to fly the LiDAR this year, but the data were not recorded. Therefore, we used the 2023 LiDAR-derived DSM to correct the BRDF to create a matchup with satellite data. This involves deriving the average local slope and slope direction for each satellite pixel and than using those parameters to correct BRDF. Whilst this method is not perfect (it does not take into account diffuse radiation from nearby terrain, for example), it does improve the comparison results. Nevertheless, we do find the comparison between ground and field data to be less than satisfactory, so we do include the results for NSW8 in overall comparisons. This may well be because our DSM is derived from data that is 2 years old, during which time the sand dunes may have shifted.
The Figure shows the changing surface elevation (left), dip magnitude (middle) and direction (right) in colours for NSW8. These data are derived from 2023 LiDAR work. The white dots represent the positions of all spectra taken with the SR-3500 and so outline the extent of the field site.