2024-04-16 MUL: Mullion, Sentinel-2B overpass
This is a report of the field data collected on 16 April 2024 at the location of Mullion to validate the satellite data of the Sentinel-2B overpass. The full collection of data is contained in the National Spectral Database. Satellite data can be found on DEA maps.
Variables
These variables and environmental factors were present on the day the data were collected.
Instrument(s) used |
ASD FR4 (18179/3) |
Time of field site measurements (UTC) |
2024-04-16 00:03:07 to 2024-04-16 00:41:16 |
Time of overpass (UTC) |
2024-04-16 00:16:28 |
GPS quality |
Good |
Reference position |
148.86258343E, 35.12279902S (WGS84) |
Matchup quality |
Excellent |
Results
The surface reflectance statistics collected on this day are grouped into bands. This allows the data to be used to validate Geoscience Australia’s other datasets that use the same standardised bands.
Band |
Sat Mean |
Sat rms |
Field mean |
Field rms |
CA |
0.048 |
0.001 |
0.055 |
0.007 |
blue |
0.058 |
0.003 |
0.069 |
0.008 |
green |
0.091 |
0.003 |
0.104 |
0.01 |
red |
0.093 |
0.005 |
0.109 |
0.015 |
RE1 |
0.153 |
0.005 |
0.165 |
0.015 |
RE2 |
0.286 |
0.01 |
0.278 |
0.021 |
RE3 |
0.312 |
0.01 |
0.314 |
0.027 |
NIR1 |
0.332 |
0.012 |
0.335 |
0.027 |
NIR2 |
0.353 |
0.012 |
0.348 |
0.028 |
SWIR2 |
0.323 |
0.008 |
0.34 |
0.032 |
SWIR3 |
0.182 |
0.007 |
0.206 |
0.029 |
Figures
The following figures provide visual representations of the data. (Click a figure to view it at full size.)
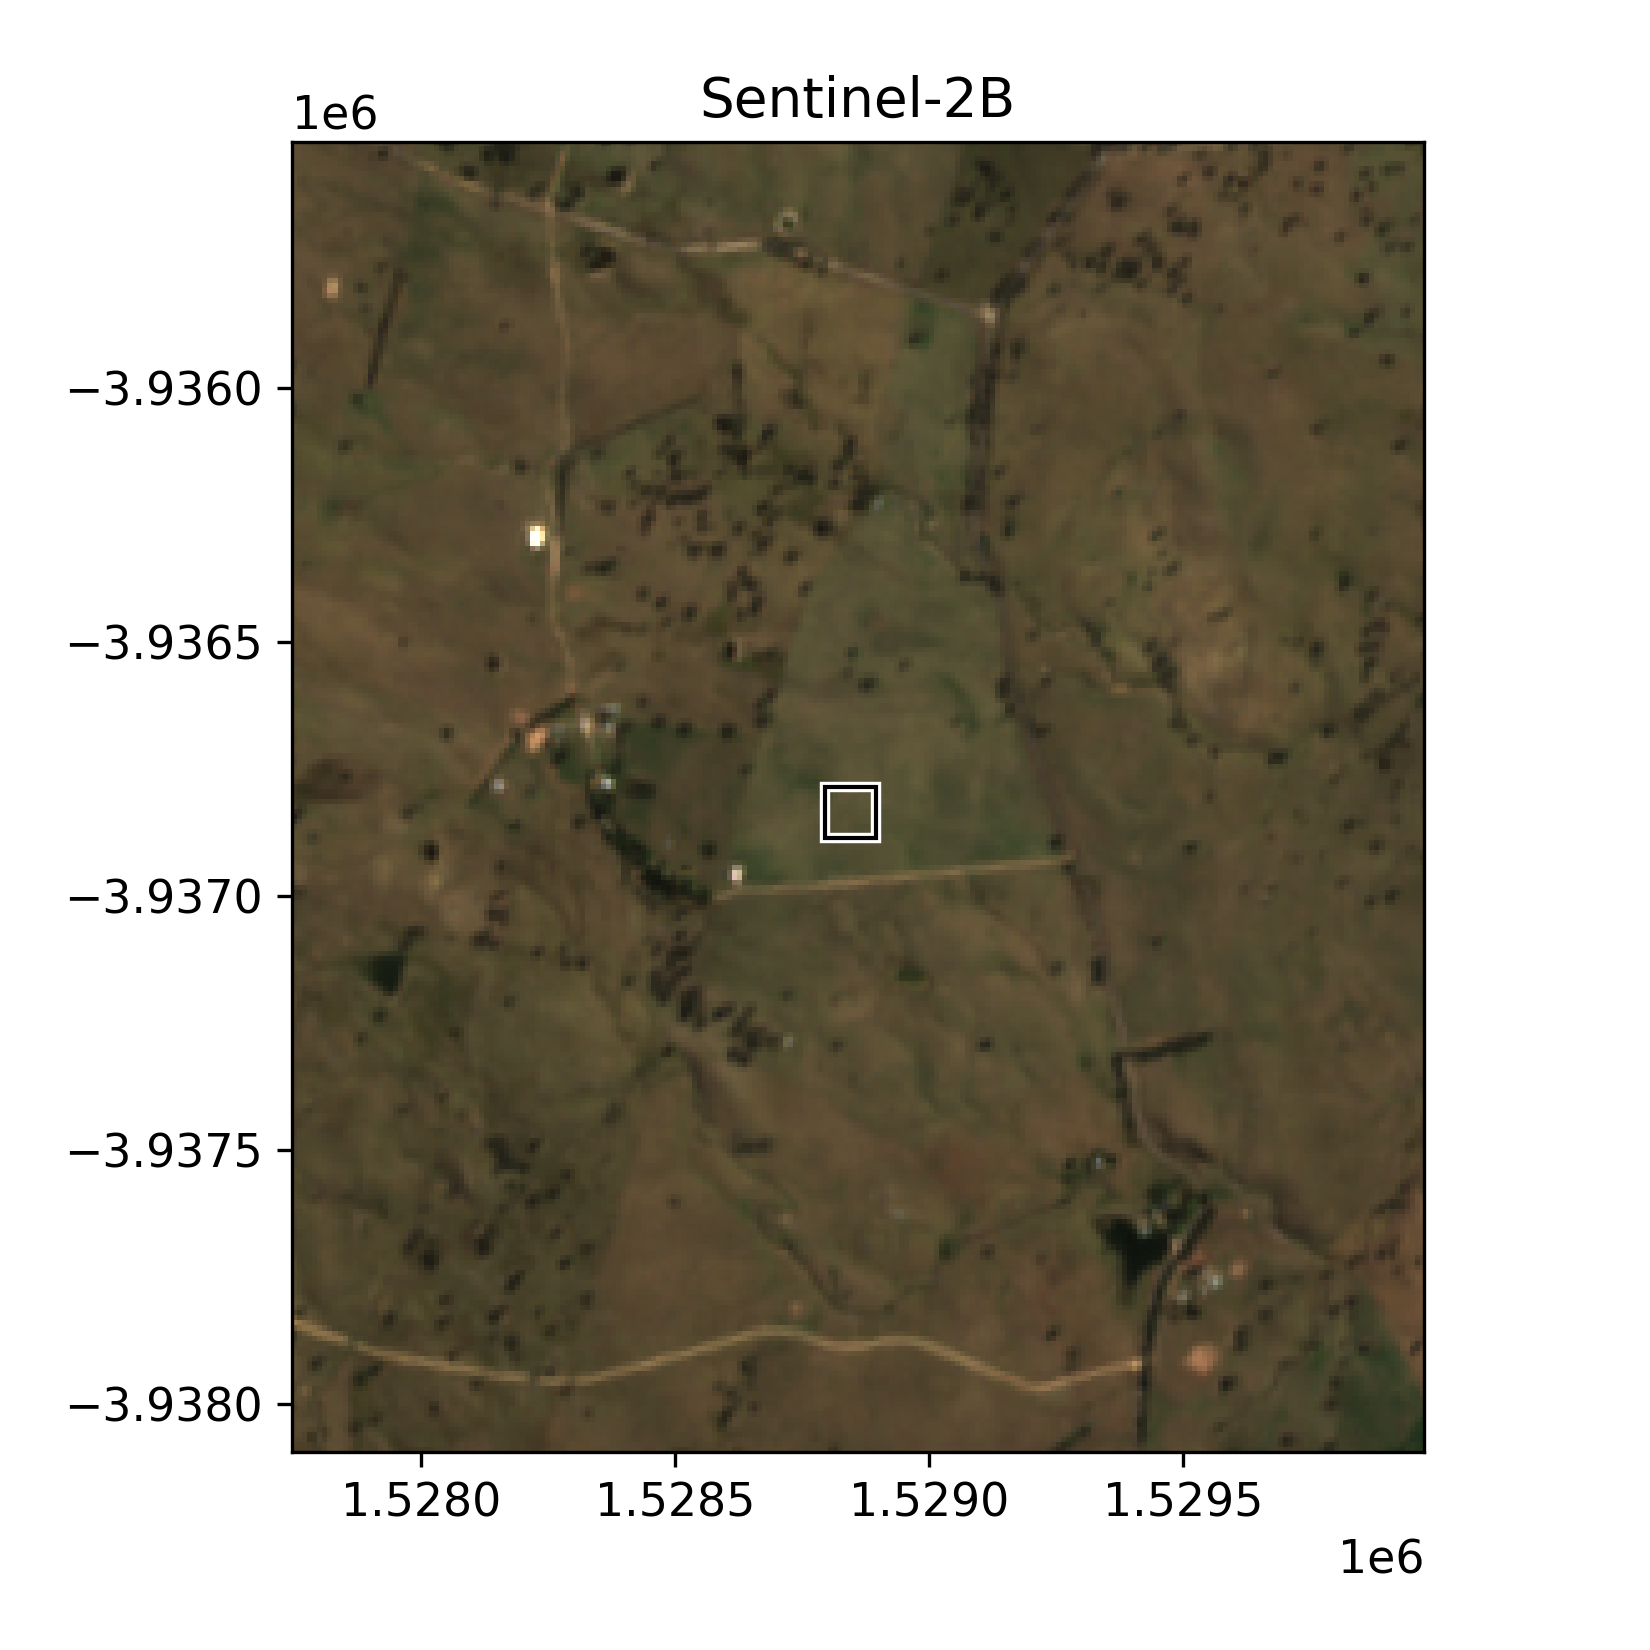
A satellite imagery tile of true colour (RGB) surface reflectance. It covers an area of approximately 2 km × 2 km. The white box indicates the size and location of the field site.
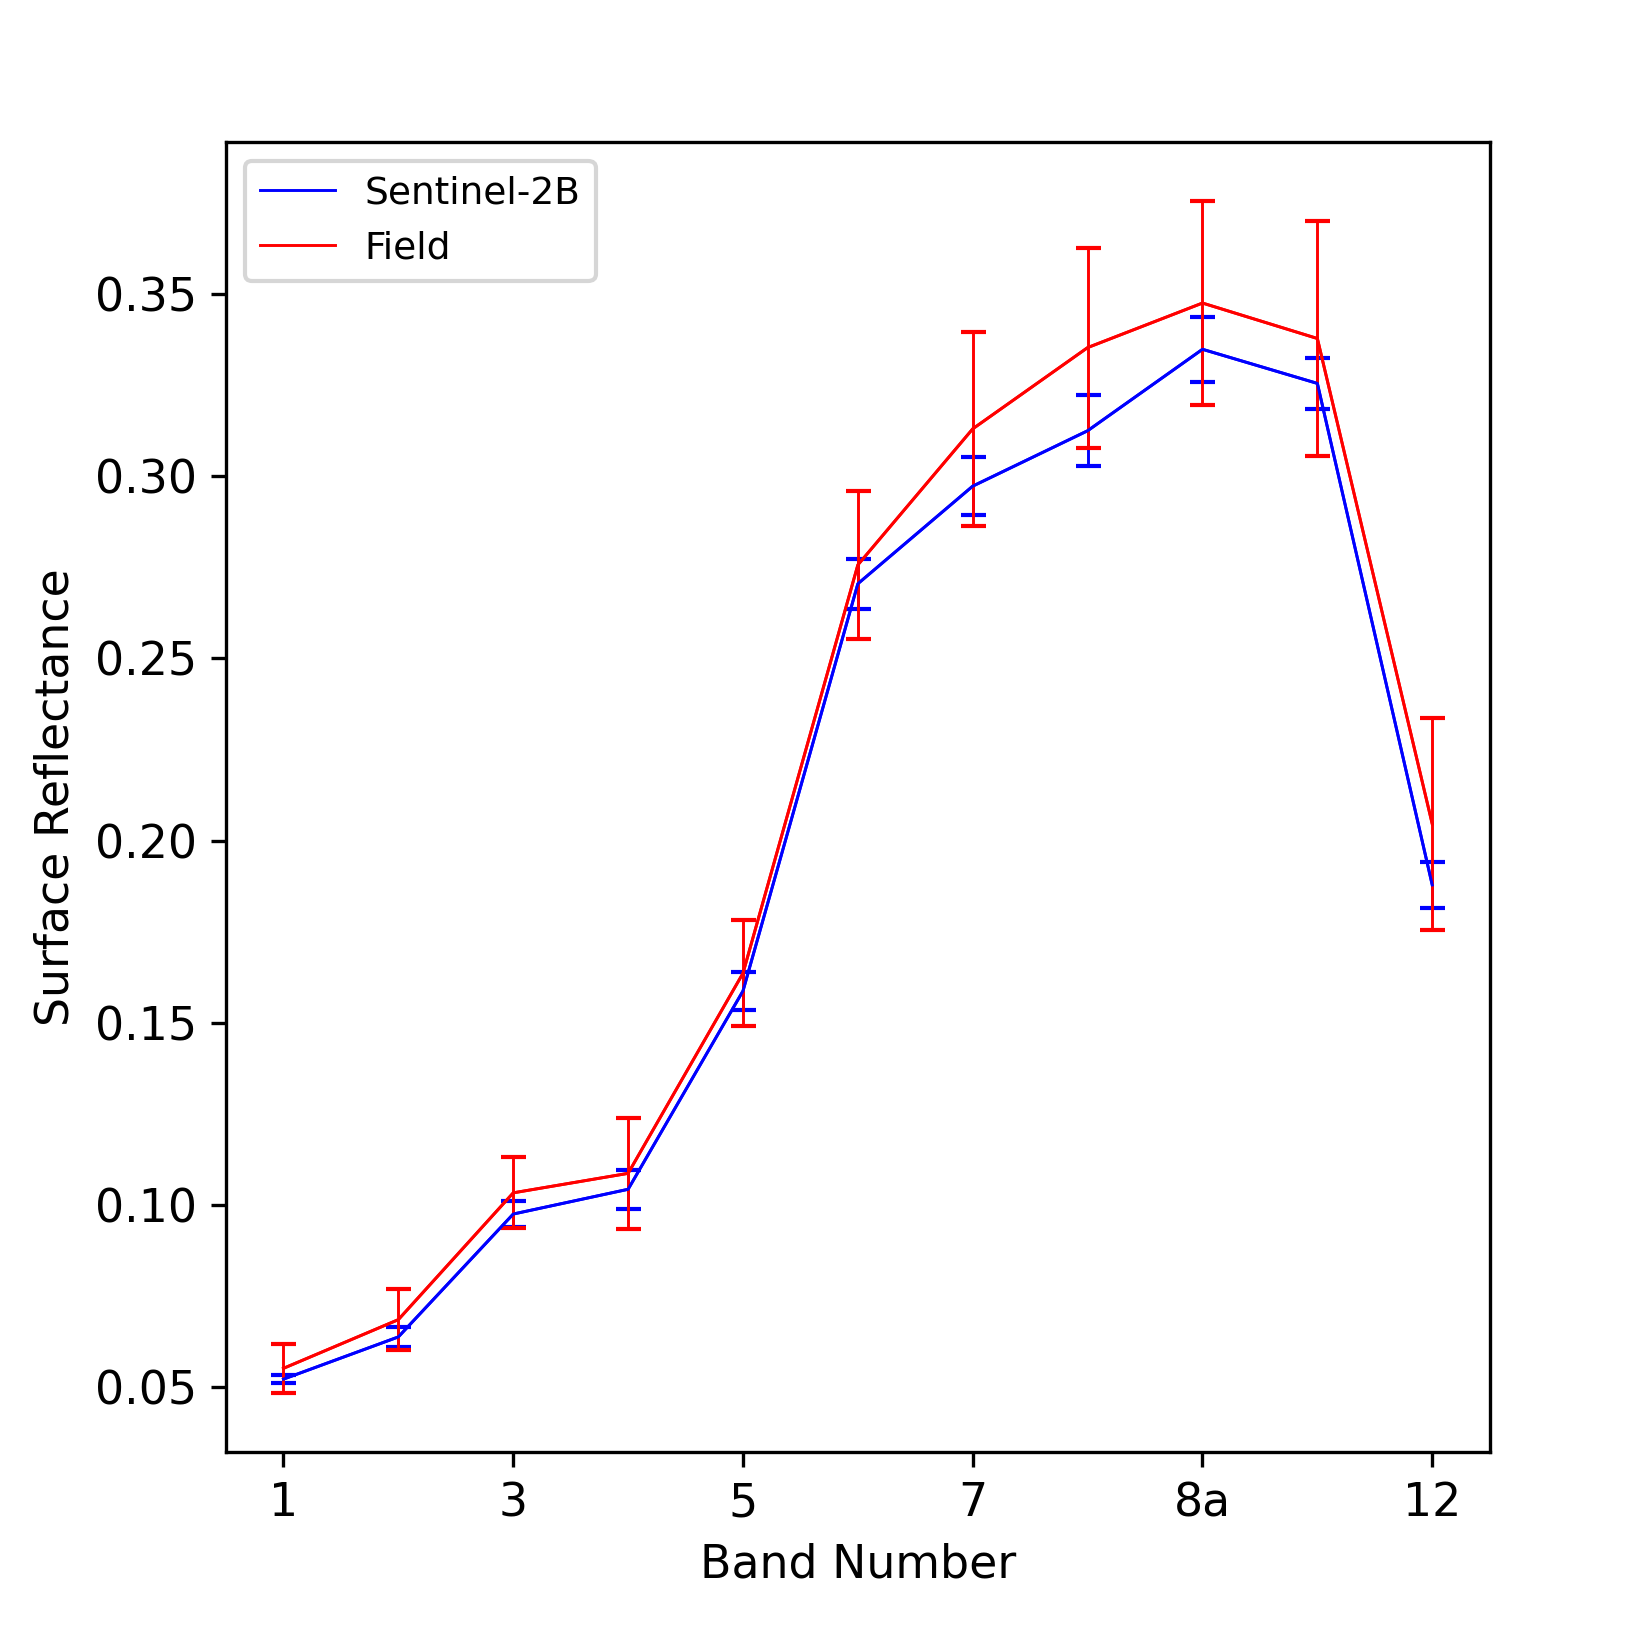
A band-by-band plot of surface reflectance for satellite and field data. Satellite uncertainty error bars for each band are the standard deviation of pixel values over and surrounding the field site. Field uncertainty error bars are the standard deviation of values after averaging all spectra within the same satellite pixels.
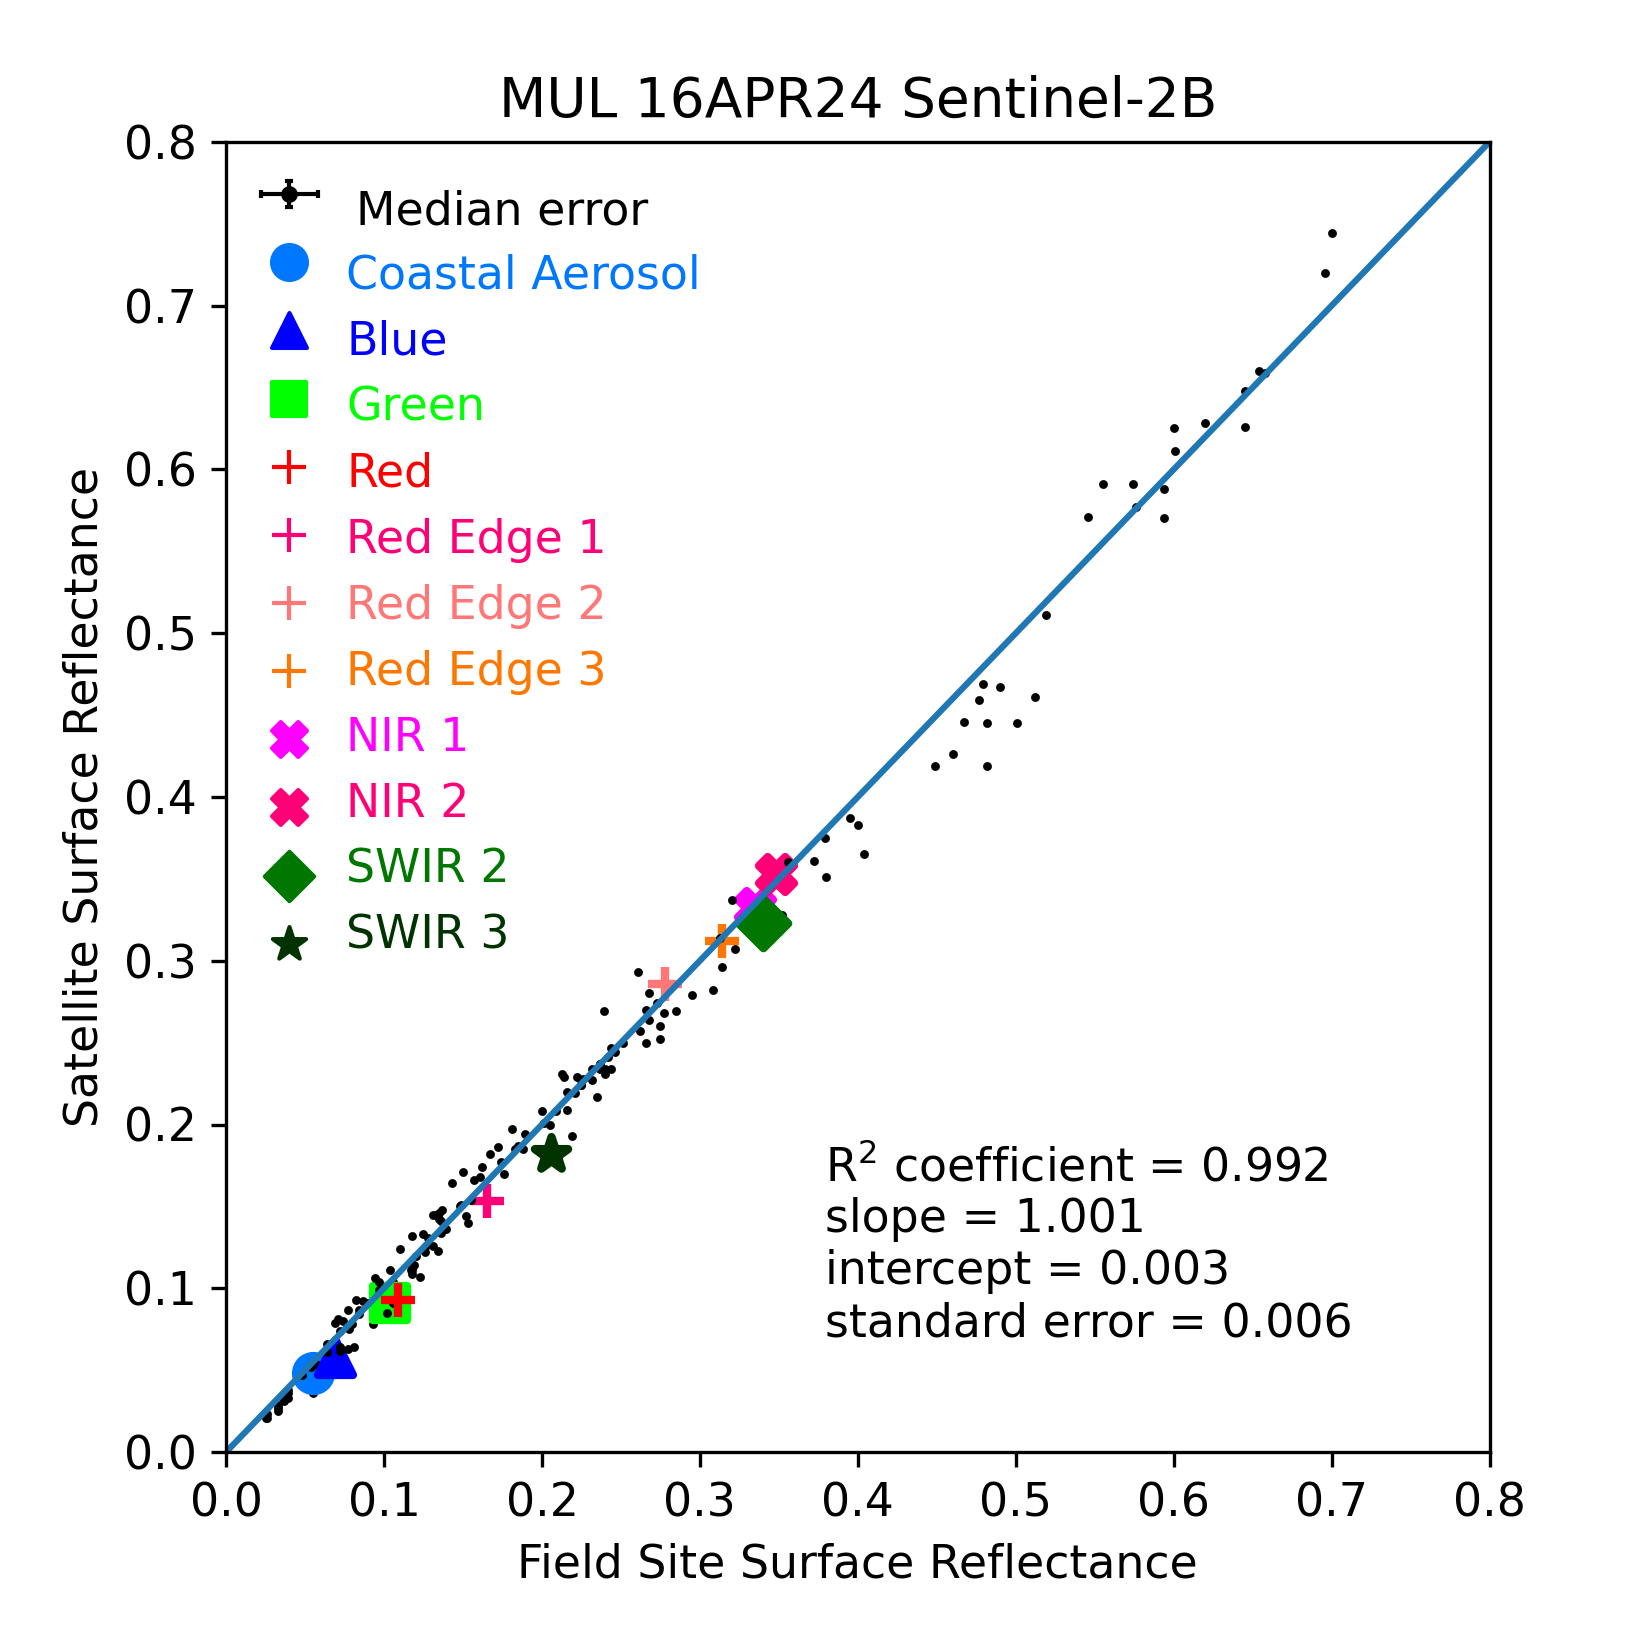
A plot of Satellite Surface Reflectance versus Field Site Surface Reflectance on this day. The solid line represents the one-to-one equality between field and satellite measurements. The black dots are the values from all field site measurements prior to this date. The line of best fit is not shown, but its parameters are given in the bottom-right corner.