2021: DEA Yearly Validation Report
Executive Summary
This Yearly report summarises validation for DEA surface reflectance products for 2021 and presents aggregate validation results to the end of this year.
During this year, a total of 4 measurements were taken across 4 field sites, to capture 7 overpasses.
Validation of Landsat 8 improved in accuracy, taking into account the data from this year.
No new data were captured during Sentinel-2A or Sentinel-2B overpasses.
The first Landsat 9 validation data were captured during the L8/9 underfly event, which comprised 3 or the 4 measurements taken.
On an averaged band-by-band basis, Landsat 8 is validated to 3.0%, Sentinel-2A is validated to 2.8% and Sentinel-2B is validated to 3.0%.
Not enough data are available to provide statistics on Landsat 9 validation.
Introduction
This yearly report presents a summary of results from 2021 from the Digital Earth Calibration/Validation team. The report is presented in the following sections:
Background — this section outlines the context around this work, with particular attention paid ton historical work leading up to this year.
Summary of Validation Work — this section provides an overall view of the field site measurements undertaken.
Comments on Individual Sites of Interest — this section focuses on any sites where some aspect of the site or measurement was atypical.
Summary of Band-by-Band Matching — this section presents comparison data for this year’s results, in the context of all previous results.
Comments on How This Year’s Work Has Affected Combined Validation Results — this section discusses how the average results for each sensor have changed with the introduction of new validation data this year. All band data for each platform is combined to show averaged validation results.
Background
The Digital Earth branch within Geoscience Australia offers a suite of Earth observation products, based on data from both Landsat and Sentinel platforms. The core products are Landsat 8 and 9 and Sentinel-2A and -2B surface reflectance (SR). To deliver these products with confidence, the Calibration/Validation team perform vicarious validation by measuring field sites with hand-held equipment or an Unstaffed Aerial Vehicle (UAV; commonly known as drone) equipment close to the time of an overpass. This work began with Phase 1, where measurements were performed by multiple groups across continental Australia. Full details on the results and methodology can be found in the Phase 1 report.
Data for both SR products and from field site measurements are made freely available. For SR products, you can visualise the data in DEA Maps, or for a more in-depth understanding and direct access to data, please visit the DEA Knowledge Hub Data Products section. Field measurement data are made available through the National Spectral Database.
As more field sites are measured and as newer measurements are made over the same field sites, the overall validation of SR products becomes more accurate. The purpose of this report is to provide an up-to-date status of validation accuracy, based on the most recent measurements.
Summary of Validation Work
4 sites were measured, with 4 individual field site captures. The Table below summarises these captures.
Site capture (Date, Field site, Overpasses) |
Latitude, Longitude (WGS84) |
Instrument |
Comments |
|---|---|---|---|
-35.12279, 148.86261 |
Hand-held ASD FR-4 |
Good matchup |
|
-32.30990, 115.86483 |
Hand-held ASD FR-4 |
Excellent matchup; L8/9 underfly |
|
-31.44932, 143.82192 |
Hand-held ASD FR-4 |
Excellent matchup; L8/9 underfly |
|
-32.20974, 148.21012 |
Hand-held ASD FR-4 |
Excellent matchup; L8/9 underfly |
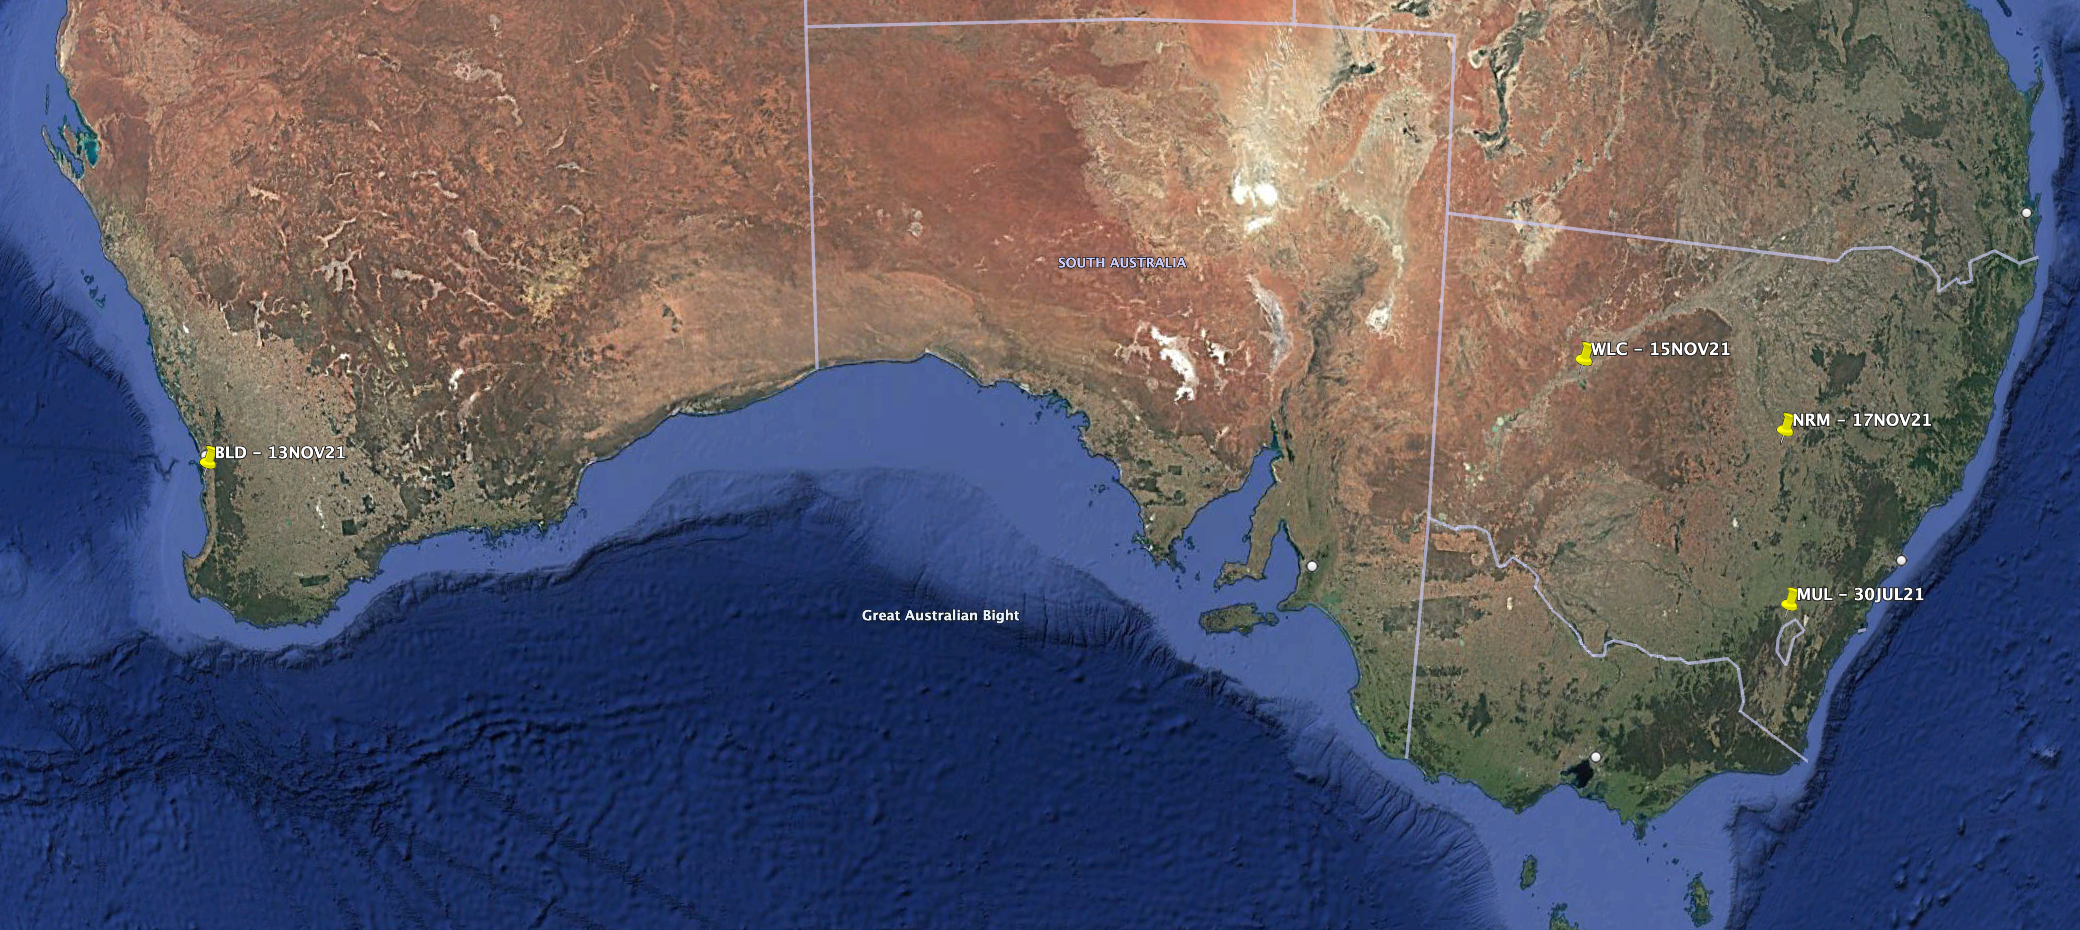
The Figure shows the locations of the field sites measured during this year.
Summary of Band-by-Band Matching
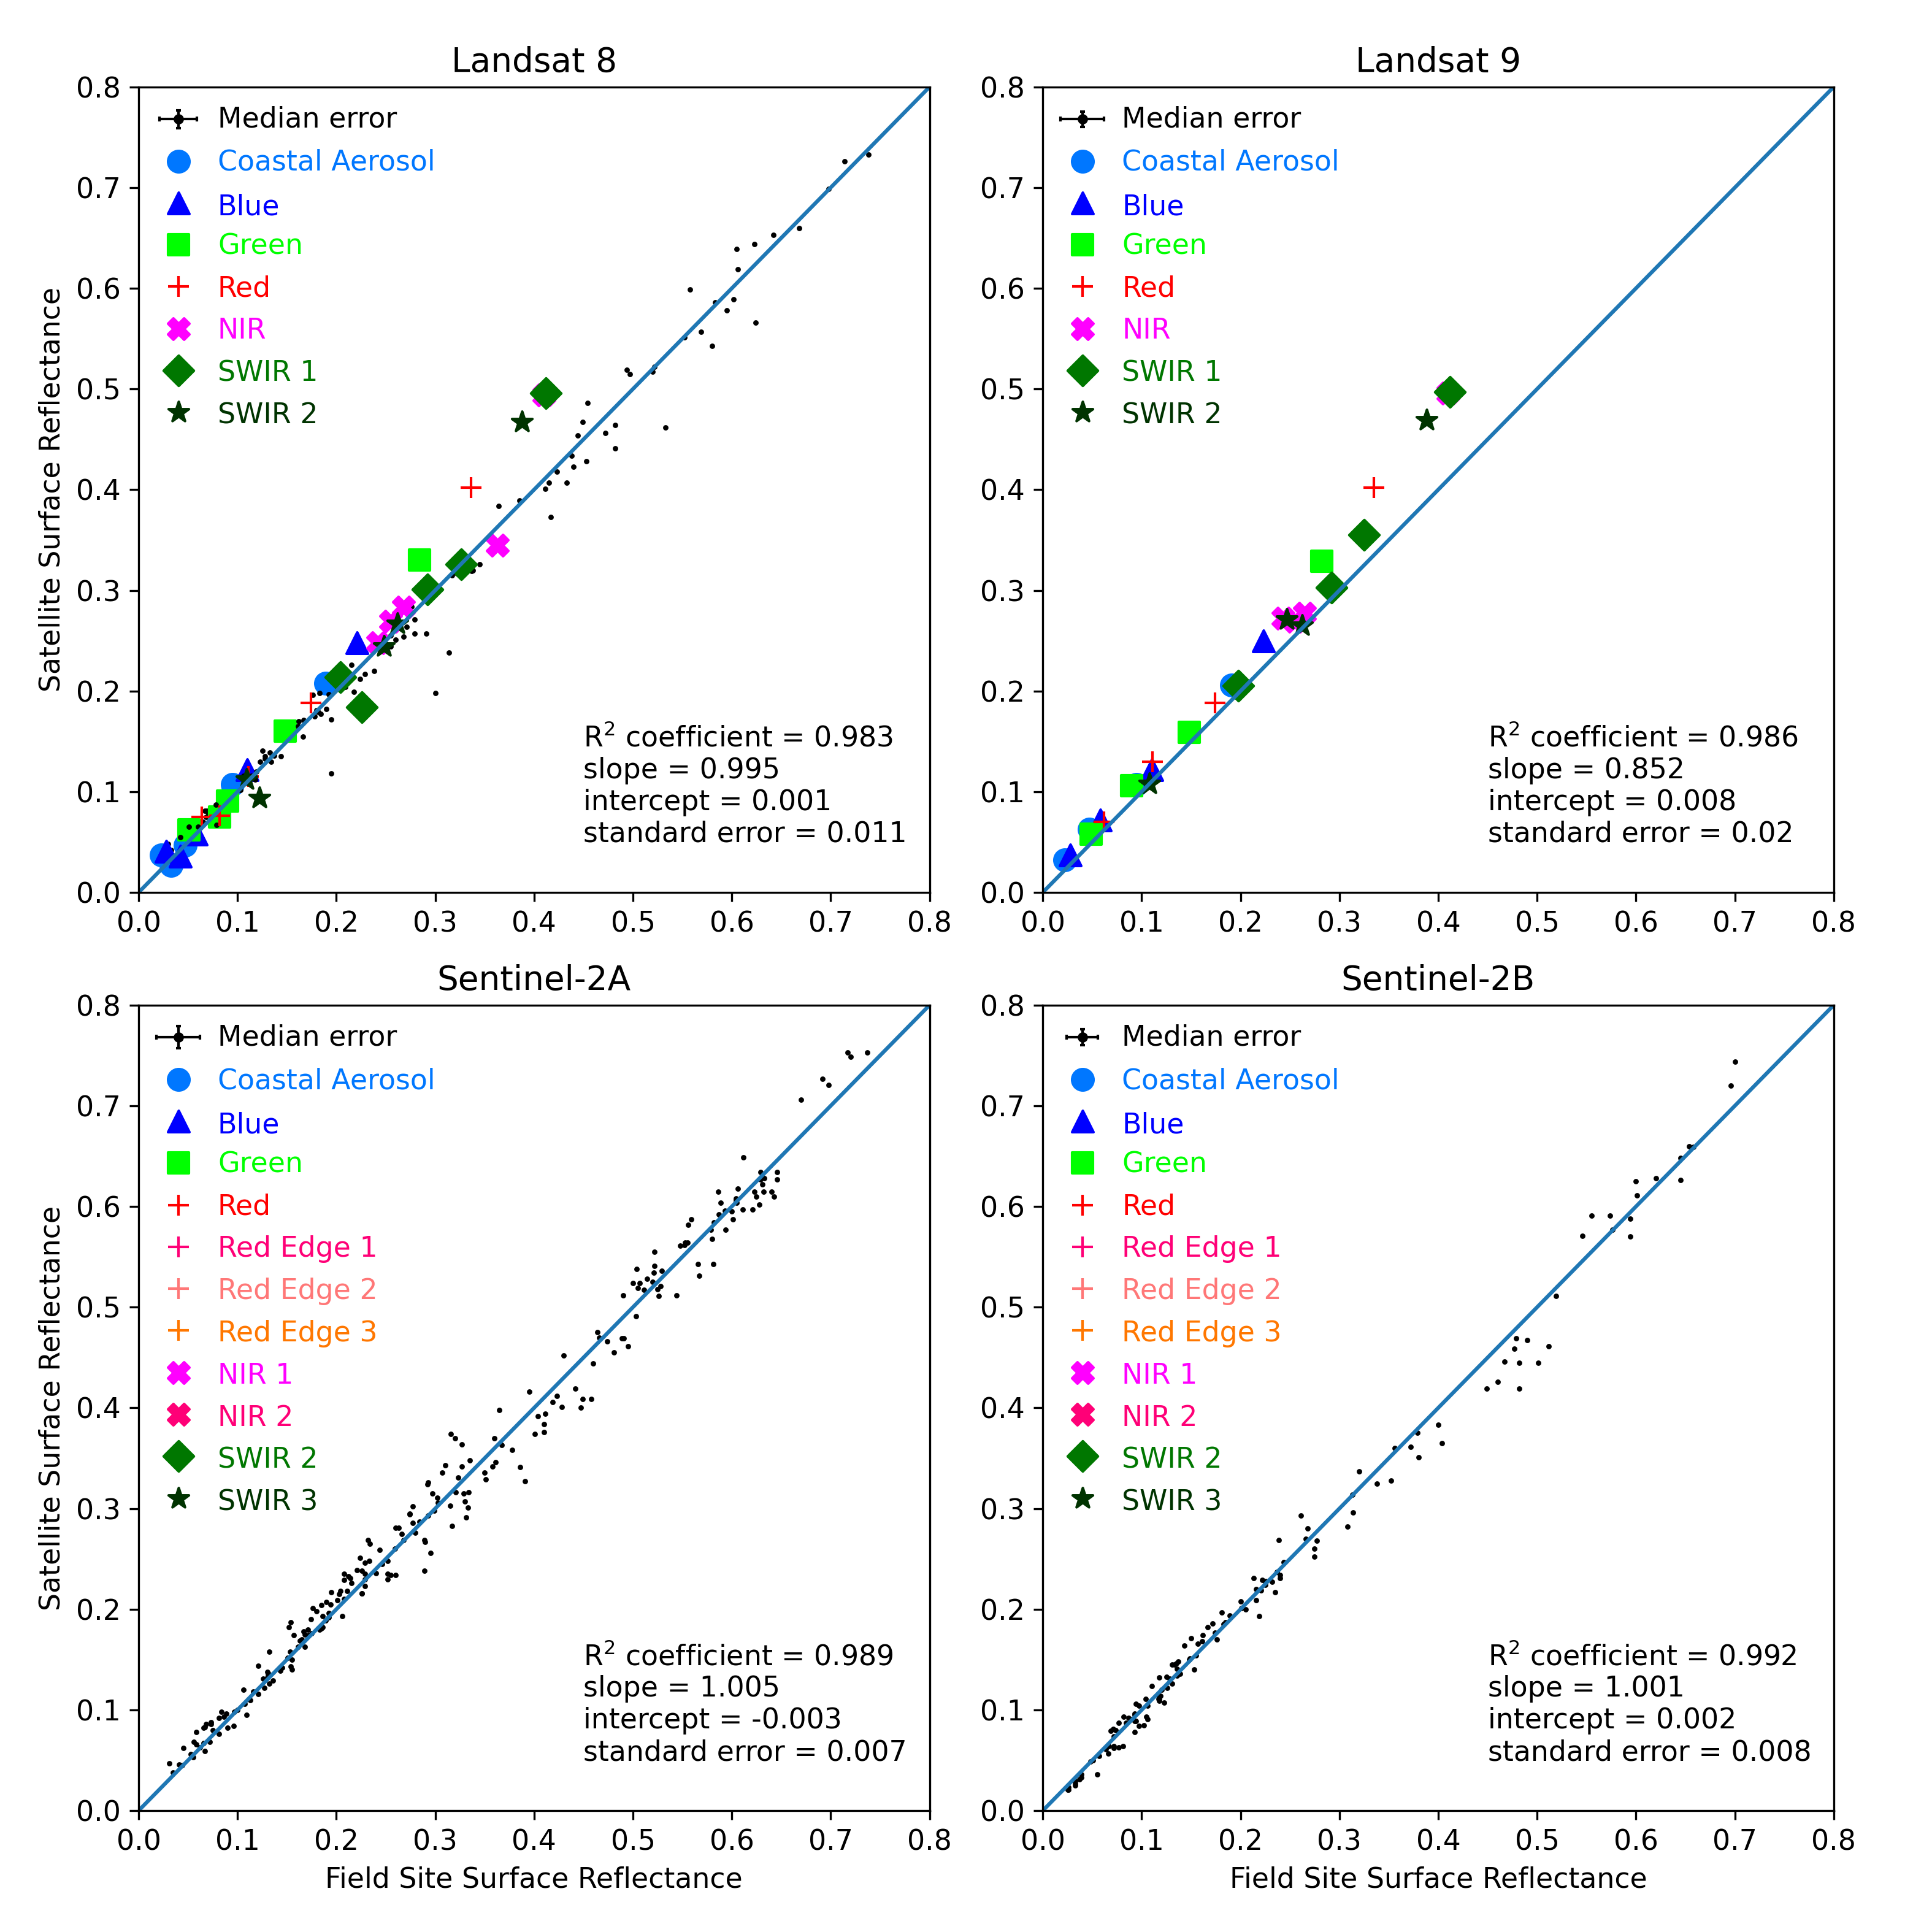
The Figure shows comparison data for each platform. Black dots represent data that were collected prior to this year. Coloured symbols represent data that were collected during this year. The diagonal line in each panel shows the one-to-one correspondence between field and satellite data. Note that this diagonal line does NOT show the line of best fit. It is plotted this way to highlight any trends where the data may be biased away from the line of one-to-one correspondence. The statistics in the bottom-right corner of each panel provide details for the line of best fit through all points up to and including this year’s data.
The Table below lists overall validation results. These are based on the standard deviation of the scatter that we find for each band of each sensor. This is when taking all the validation results together, up to and including this year’s results. The band-by-band scatter is representative of the validation performance of each band. Rather than providing values for each individual band, we characterise all results by looking at the mean and maximum scatter for each platform.
Satellite platform |
Mean band-by-band scatter |
Maximum band-by-band scatter |
|---|---|---|
Landsat 8 |
3.0% |
4.1% |
Landsat 9 |
—-% |
—-% |
Sentinel-2A |
2.8% |
3.7% |
Sentinel-2B |
3.0% |
4.3% |
For example, the Table shows that each Landsat 8 band is typically validated to 3.0%, with the worst performance of a band being 4.1%. Note that there are no scatter statistics for Landsat 9. This is because this year was the first including Landsat 9 results, as part of the Landsat8/9 underfly.
Effect on Cumulative Validation Results
This section discusses the effect that this year’s validation results have had on the total validation results over all time.
For Landsat 8, this year has seen an overall improvement in validation results. There were 4 field site comparison measurements.
For Landsat 9, this was the first year that validation data were collected. There were 3 field site comparison measurements.
For Sentinel-2A, this quarter has seen no change in validation results. There were no field site comparison measurements.
For Sentinel-2B, this quarter has seen no change in validation results. There were no field site comparison measurements.
Fractional Cover Validation
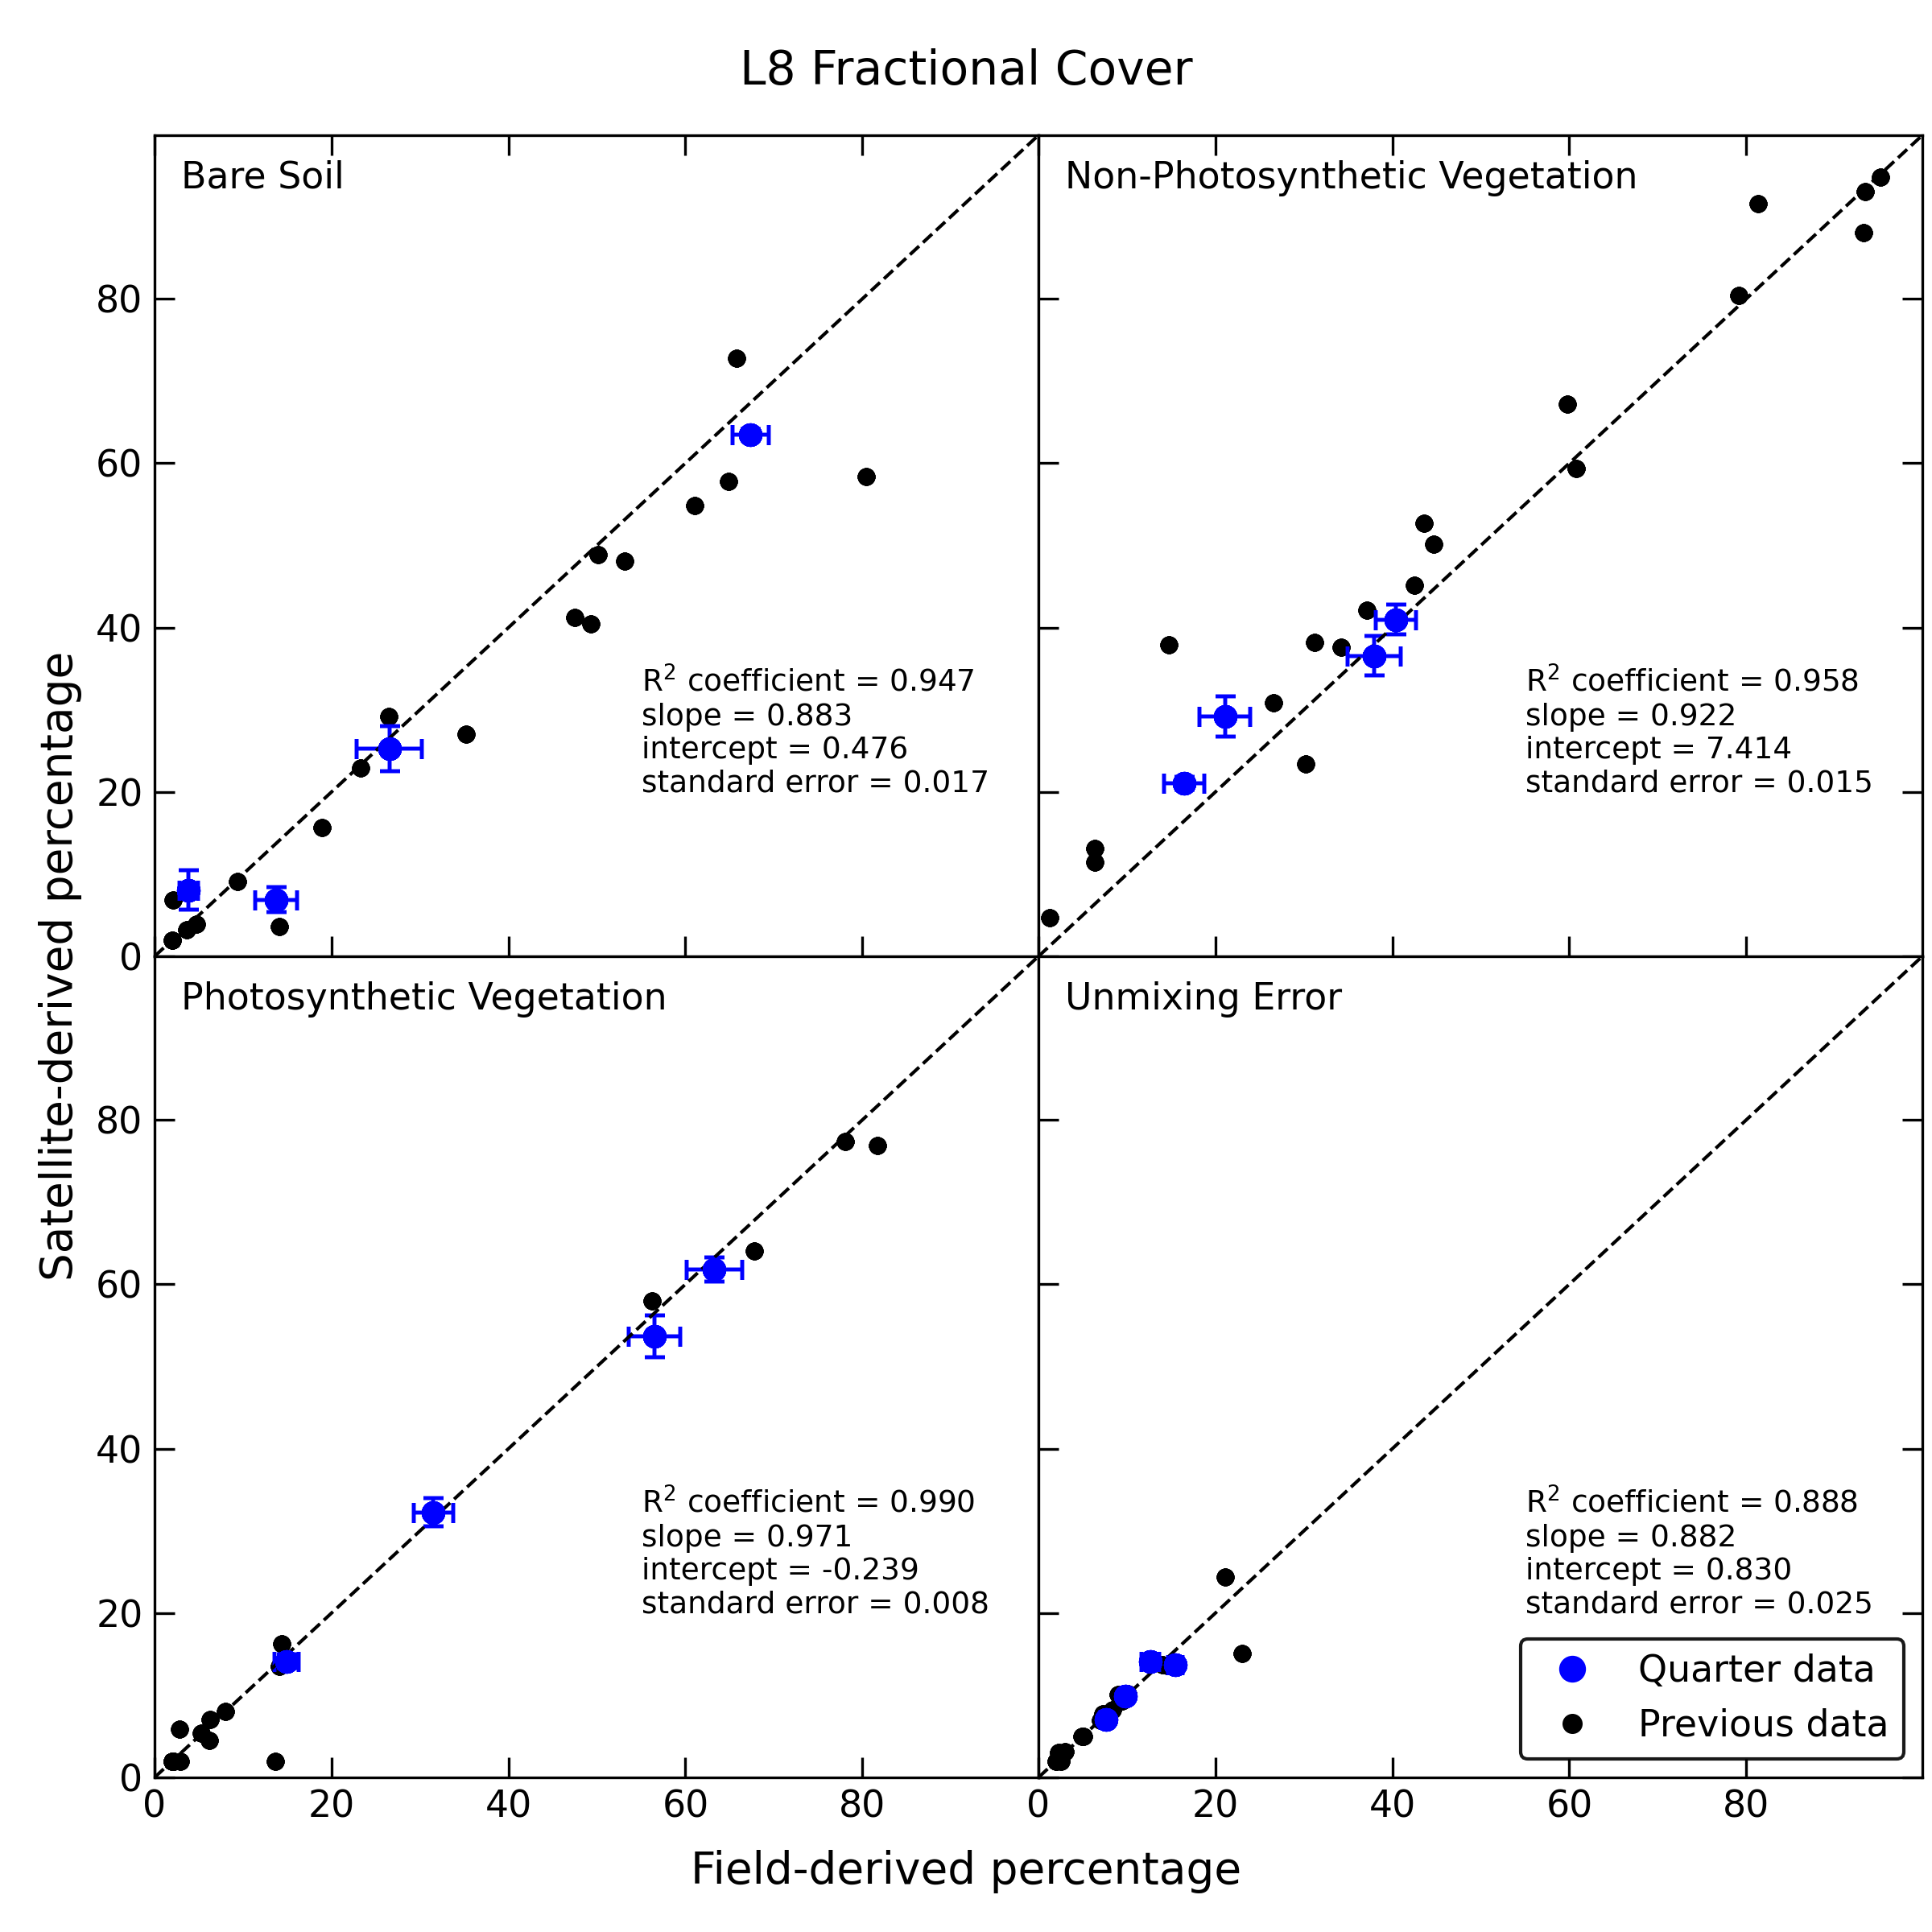
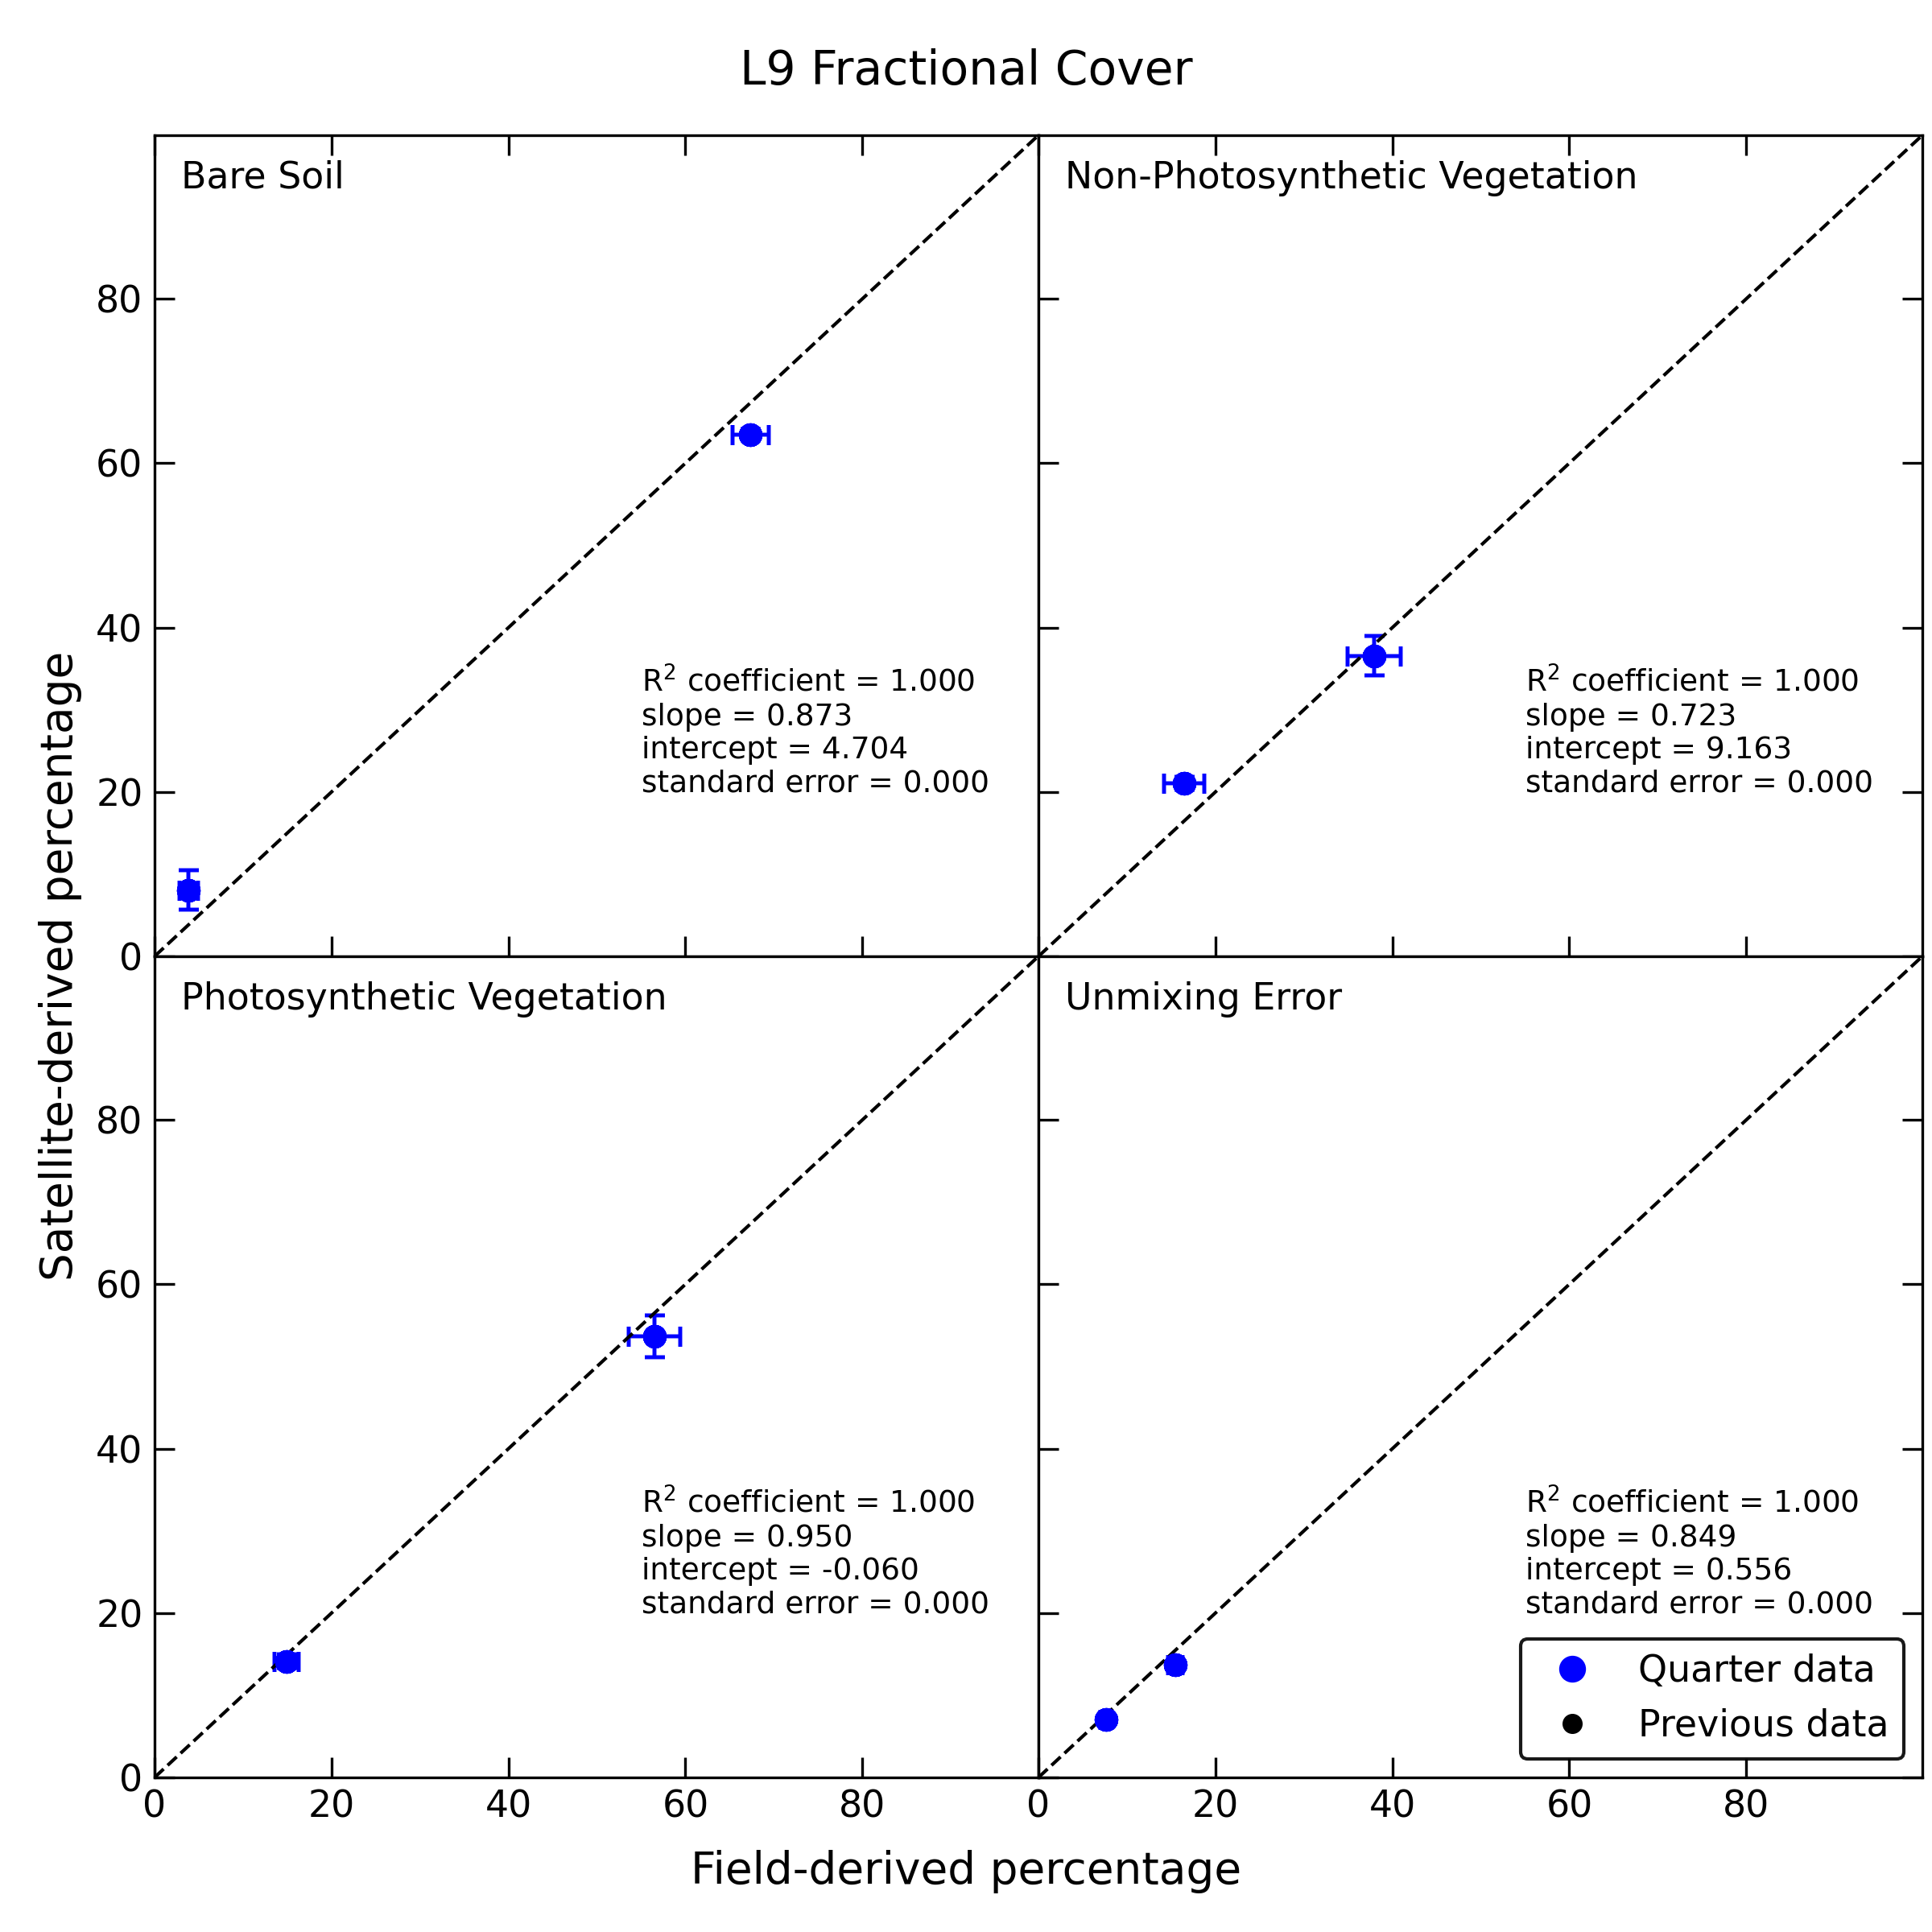
The above Figures show a comparison of this Year’s validation data (shown in blue) vs. previous data (black) for Landsat 8 and 9. The diagonal dashed lines show the one-to-one correspondence and NOT the line of best fit between the points. The line of best fit is represented by the parameters shown in the bottom-right of each panel, including \(R^2\) correlation coefficient, slope, intercept and standard deviation. Blue points, which include data for this Quarter, also show uncertainty error bars. Black dots represent data that were collected prior to this Quarter. For each Figure, panels show the four Fractional Cover (FC) parameters: Bare Soil (BS, top-left), Non-Photosynthetic Vegetation (NPV, top-right), Photosynthetic Vegetation (PV, bottom-left) and Unmixing Error (UE, bottom-right).
Note that the Fractional Cover (FC) comparison does not compare results with a ‘ground truth’, but is a comparison of derived FC parameters based on satellite SR (vertical axis) and field SR (horizontal axis).
Acknowledgments
The field validation data were collected by Geoscience Australia.
Comments on Individual Sites of Interest
Most of the measurements taken during this year were part of the Landsat 8/9 underfly event, which occurred in November, 2021. This includes BLD, WLC and NRM. Further details on the underfly results can be found in the journal article: Validating Digital Earth Australia NBART for the Landsat 9 Underfly of Landsat 8.