DEA Fuel Moisture Content (Sentinel-2)
DEA Fuel Moisture Content (Sentinel-2)
- Version:
- Type:
Derivative, Raster
- Resolution:
20 m
- Coverage:
12 July 2015 to Present
- Data updates:
Weekly frequency, Ongoing
Important
DEA Fuel Moisture Content (FMC) is not to be used for real-time emergency response or safety-of-life decisions.
About
Digital Earth Australia (DEA) Fuel Moisture Content (FMC) provides a measure of vegetation moisture by calculating the percentage of water mass relative to dry mass in living vegetation. Available for every Sentinel-2 satellite overpass since 2015, it enables valuable insights into vegetation moisture and flammability across the Australian landscape.
Access the data
For help accessing the data, see the Access tab.
Key specifications
For more specifications, see the Specifications tab.
Technical name |
Geoscience Australia Sentinel-2 Fuel Moisture Content |
Bands |
|
DOI |
|
Parent products |
DEA Surface Reflectance NBART (Sentinel-2A MSI), DEA Surface Reflectance NBART (Sentinel-2B MSI), DEA Surface Reflectance NBART (Sentinel-2C MSI) |
Collection |
Geoscience Australia Sentinel-2 Collection 3 |
Licence |
Cite this product
Data citation |
Geoscience Australia, 2025. DEA Fuel Moisture Content (Sentinel-2). Geoscience Australia, Canberra. https://dx.doi.org/10.26186/150554
|
Paper citation |
Yebra, M., Quan, X., Riaño, D., Rozas Larraondo, P., van Dijk, A. I. J. M., & Cary, G. J., 2018. A fuel moisture content and flammability monitoring methodology for continental Australia based on optical remote sensing. Remote Sensing of Environment, 212, 260–272. https://doi.org/10.1016/j.rse.2018.04.053
|
Publications
Yebra, M., Quan, X., Riaño, D., Rozas Larraondo, P., van Dijk, A. I. J. M., & Cary, G. J., 2018. A fuel moisture content and flammability monitoring methodology for continental Australia based on optical remote sensing. Remote Sensing of Environment, 212, 260–272. https://doi.org/10.1016/j.rse.2018.04.053
Background
Australia’s hot, dry climate and vast bushland make it one of the most fire-prone regions on Earth. Understanding vegetation dryness is critical for managing bushfire risk.
One key measure used for this purpose is Fuel Moisture Content (FMC) which refers to the amount of water contained in vegetation, expressed as a percentage of its dry weight. FMC plays a vital role in fire management because it indicates how easily vegetation can ignite and sustain fire; lower FMC levels mean drier and more flammable fuel. Digital Earth Australia (DEA) FMC is a remotely sensed proxy of FMC.
Use constraints
This product is not meant to replace field measurements of fuel moisture. It is intended to be used in conjunction with that information and interpreted by people with expert knowledge.
Your use of, reliance on, and any further distribution of any aspect of the DEA Fuel Moisture Content (FMC) product is entirely at your own risk.
What this product offers
DEA Fuel Moisture Content (FMC) product is a remotely sensed proxy for the moisture content of vegetation. It estimates the percentage of water mass relative to dry mass in living vegetation based on its spectral signature. Vegetation moisture is a critical variable for understanding vegetation flammability and fire potential.
Values range from 0–300%, representing by weight percent the amount of water in leaves compared to dry plant material. A value of 0% would indicate that there is no water content. A value of 100% indicates there is an equal weight of water and dry plant material. A value of 300% would mean there is approximately three times as much water as dry plant material. Values in the range of 0–150% are particularly relevant to fire behaviour analysis, as this range is strongly associated with changes in vegetation flammability and the likelihood of ignition.
DEA FMC is derived from Sentinel-2 NBART satellite imagery at a 20 m resolution for all of Australia from 12 July 2015 to the present. It provides pixel-level FMC values for each corresponding Sentinel-2 scene, with masking applied to exclude clouds, cloud shadows, water, and terrain shadows.
Applications
Monitoring and mapping the dryness of vegetation across different landscapes.
Predicting and assessing vegetation flammability and fire risk, including fire spread and intensity.
Modelling fire risk over time and across different ecosystems with changing climate conditions.
Prioritising and evaluating fire, forestry, and utility agency management based on the dryness and the assessed fire risk of vegetation.
Please note that this product should not be used to make safety of life decisions.
Technical information
DEA Fuel Moisture Content (FMC) is a gridded dataset indicating the moisture content of vegetation. This product includes measurements taken between 12 July 2015 and the present (inclusive) from the Sentinel-2A, 2B, and 2C satellites. DEA FMC covers all of mainland Australia and Tasmania but excludes offshore territories. The dataset is updated automatically as each new Sentinel-2 scene is acquired and processed as Analysis Ready Data (ARD).
The calculation of DEA FMC is done using a random forest machine learning model which is an emulator of the model used in the MODIS-based Australian Flammability Monitoring System (AFMS) (Yebra et al, 2018). The inputs to the model are the Sentinel-2 bands (blue, green, red, red edge 1, 2, and 3, NIR 1 and 2, and SWIR 2 and 3). In addition, two normalised difference indices are used (NDVI Rouse (1973) and NDVII Hunt and Rock (1989)). All input bands are loaded at 20 × 20 m resolution. The visible light bands that have a resolution of 10 m are resampled using Bilinear sampling. Masking for cloud, cloud shadow, water, and terrain shadow are also applied.
Lineage
This product is based on the work of Dr. Marta Yebra and the team at the Bushfire Research Centre of Excellence at the Australian National University (ANU). Remotely sensed FMC was developed and delivered as the Australian Flammability Monitoring System (AFMS) with support from Natural Hazards Research Australia.
DEA FMC replaces the MODIS-based AFMS, improving the spatial resolution from 500 m to 20 m.
References
Yebra, M., Quan, X., Riaño, D., Rozas Larraondo, P., van Dijk, A. I. J. M., & Cary, G. J., 2018. A fuel moisture content and flammability monitoring methodology for continental Australia based on optical remote sensing. Remote Sensing of Environment, 212, 260–272. https://doi.org/10.1016/j.rse.2018.04.053
Limitations
This product depends on having clear skies in order to observe the landscape, as both cloud and smoke will obstruct the observation of the Earth’s surface. Furthermore, the three Sentinel-2 satellites (A, B, and C) which are the basis of this service each view a given 320 km wide strip of Australia once every 10 days. This means there will be up to a 5-day gap between observations of any point on the Australian continent. The observations show only what was visible at the time that the satellite passed overhead. Since weather conditions can change rapidly, the actual condition of vegetation on the ground may change between the last time that the satellite went overhead and the next time it passes the same location.
No decisions on life or property should be made based on this data. For local updates and alerts, please refer to your state emergency or fire service.
Quality assurance
Cloud masking is conducted using the Sentinel-2 Fmask algorithm. This algorithm’s performance on Sentinel-2 has known issues, in particular the issue of false negatives in cloud detection. This is due to Sentinel-2 A, B, and C lacking a thermal IR band which would be used for detecting clouds. At the time of publication, the Fmask cloud algorithm is the best choice available; however, in the future, other options may become available.
Accuracy
Validation campaigns are being undertaken to evaluate the accuracy of the remotely sensed FMC estimates across a range of vegetation types and environmental conditions. These field-based data collections provide important reference measurements that will support further refinement of the product and help ensure confidence in its use. Validation results and reference values will become available as more validation campaigns are completed.
Product ID
The Product ID is ga_s2_fmc_3_v1. This ID is used to load data from the Open Data Cube (ODC), for example dc.load(product="ga_s2_fmc_3_v1", ...)
Bands
Bands are distinct layers of data within a product that can be loaded using the Open Data Cube (on the DEA Sandbox or NCI) or DEA’s STAC API. Note that the Coordinate Reference System (CRS) of these bands is Multiple UTM zone CRSs.
Type |
Units |
Resolution |
No-data |
Aliases |
Description |
|
|---|---|---|---|---|---|---|
fmc |
int16 |
- |
20 m |
-999 |
- |
Fuel Moisture Content value, ranging from 0 to 300%. |
Product information
This metadata provides general information about the product.
Product ID |
ga_s2_fmc_3_v1
|
Used to load data from the Open Data Cube. |
Short name |
DEA Fuel Moisture Content (Sentinel-2) |
The name that is commonly used to refer to the product. |
Technical name |
Geoscience Australia Sentinel-2 Fuel Moisture Content |
The full technical name that refers to the product and its specific provider, sensors, and collection. |
Version |
1.0.0 |
The version number of the product. |
Lineage type |
Derivative |
Derivative products are derived from other products. |
Spatial type |
Raster |
Raster data consists of a grid of pixels. |
Spatial resolution |
20 m |
The size of the pixels in the raster. |
Temporal coverage |
12 July 2015 to Present |
The time span for which data is available. |
Coordinate Reference System (CRS) |
Multiple UTM zone CRSs |
The method of mapping spatial data to the Earth’s surface. |
Update frequency |
Weekly |
The expected frequency of data updates. Also called ‘Temporal resolution’. |
Update activity |
Ongoing |
The activity status of data updates. |
DOI |
The Digital Object Identifier. |
|
Catalogue ID |
The Data and Publications catalogue (eCat) ID. |
|
Licence |
See the Credits tab. |
Product categorisation
This metadata describes how the product relates to other products.
Parent products |
DEA Surface Reflectance NBART (Sentinel-2A MSI), DEA Surface Reflectance NBART (Sentinel-2B MSI), DEA Surface Reflectance NBART (Sentinel-2C MSI) |
Collection |
Geoscience Australia Sentinel-2 Collection 3 |
Tags |
geoscience_australia_sentinel_collection_3, fuel_moisture_content, vegetation, hazards |
Access the data
DEA Maps |
Learn how to use DEA Maps. |
|
DEA Explorer |
Learn how to use the DEA Explorer. |
|
Data sources |
Learn how to access the data via AWS. |
|
Code examples |
Learn how to use the DEA Sandbox. |
|
Web services |
Learn how to use DEA’s web services. |
How to view the data in a web map
To view and access the data interactively, start by exploring DEA Fuel Moisture Content on DEA Maps.
Or, you can manually add the DEA Fuel Moisture Content layer to DEA Maps:
Open DEA Maps.
Click Explore data.
Click Hazards > DEA Fuel Moisture Content > DEA FMC Sentinel-2 (A, B & C) or DEA FMC Sentinel-2 Most Recent Observation.
Click Add to the map, or the ‘+’ symbol to add the data to the map.
How to load data with Python in the DEA Sandbox (Recommended)
DEA Sandbox allows you to explore DEA’s Earth Observation datasets in a JupyterLab environment. See the guide to get started with the DEA Sandbox.
Once you have signed up to the Sandbox, click into the DEA products directory to find the Introduction to DEA Fuel Moisture Content notebook. This notebook will walk you through loading and visualising the DEA Fuel Moisture Content data.
How to load data into a local environment using Python and STAC (Recommended)
Use the DEA Explorer Spatio-Temporal Asset Catalog (STAC) API to load DEA data through the odc-stac Python package.
Use ga_s2_fmc_3_v1 for the STAC “collection” ID for DEA Fuel Moisture Content.
How to add data to QGIS using the OWS web service
Note: You must be using QGIS version 3.22 or above to use the time dimension.
From the top menu bar, click Layer > Add Layer > Add WMS/WMTS Layer.
Click New to set up a new data source, then enter the following.
Name:
DEA ServicesURL:
https://ows.dea.ga.gov.au/
Click Connect.
Once the items appear, you can choose which layers to add.
Click Hazards > DEA Fuel Moisture Content, then select either of the following options:
DEA FMC Sentinel-2 (A, B & C) or,
DEA FMC Sentinel-2 Most Recent Observation
Click Add.
How to add data to Esri using the OWS web service
From the top menu bar, click Insert > Connections > Server > New WMS Server.
Enter the following into Server URL:
https://ows.dea.ga.gov.au/Click OK.
Once the WMS server appears in the Servers folder in the Catalog, you can choose which layers to add.
Open each group using the dropdown arrow and navigate to Hazards > DEA Fuel Moisture Content, then select either of the following options:
DEA FMC Sentinel-2 (A, B & C) or,
DEA FMC Sentinel-2 Most Recent Observation
Right-click and Add to current map or drag onto Map.
How to download data via web browser from DEA Explorer
Using the DEA Explorer site:
Navigate to the DEA FMC Sentinel-2 page.
Using the interactive map and time filters, select the tile of interest.
Find the GeoTIFF file under Location and click to download it directly.
How to download data via web browser from DEA Public Data AWS
Using DEA’s Public Data site:
Navigate to the DEA FMC Sentinel-2 data folder.
Navigate through the folders to the tile and date of interest, then click the GeoTIFF file of the relevant layer to download it directly.
Note that to find the X and Y tile values for a particular area, you can use the interactive map in DEA Explorer (see above).
Version history
No previous versions are available.
Changelog
Version 1.0.0
The first version of DEA Fuel Moisture Content (FMC) was released in October 2025. It replaces the MODIS-based Australian Flammability Monitoring System (AFMS), improving the spatial resolution from 500 m to 20 m. This product is based on the work of Dr. Marta Yebra and the team at the Bushfire Research Centre of Excellence at the Australian National University (ANU) with support from Natural Hazards Research Australia.
Frequently asked questions
Why does the colour bar only go up to 150% whereas the FMC values go to 300%?
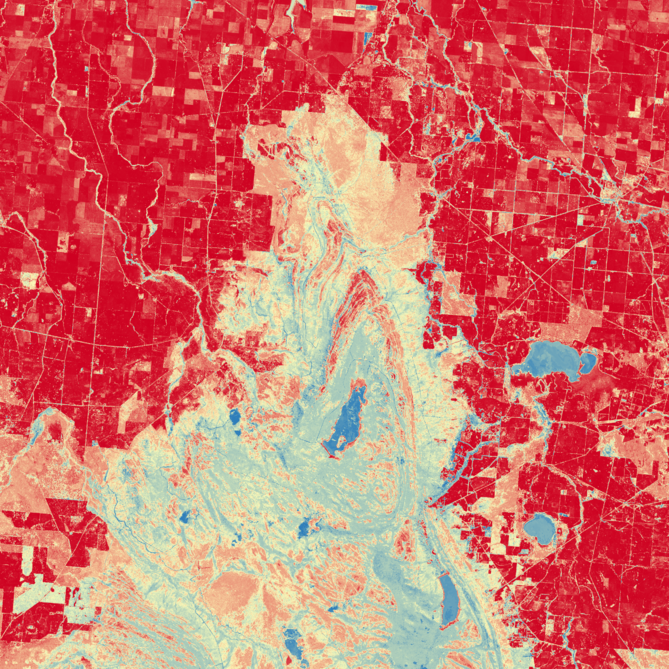
In DEA Maps, the DEA FMC product is visualised using a colour scale that only represents values in the range of 0% to 150%. All values above 150% are displayed in a constant dark blue colour. This provides a more focused view of the 0–150% range which is the range that is of most interest to understand flammability.
Where is the data for the latest Sentinel-2 satellite overpass?
DEA FMC uses Sentinel-2A, 2B, and 2C Analysis Ready Data (ARD) products at the ‘Final’ maturity level. Unlike the ‘Near Real Time’ (NRT) ARD dataset, the ‘Final’ ARD is generated using higher-quality ancillary datasets, which require more time to become available. As a result, there is a delay between the time of satellite acquisition and the time that the finalised ARD imagery used in FMC processing becomes available. For more information, see the DEA Dataset Maturity guide.
Acknowledgments
The fuel moisture content algorithm was developed by the Australian National University (ANU) with support from Natural Hazards Research Australia and is described in Yebra et al. (2018).
License and copyright
© Commonwealth of Australia (Geoscience Australia).
The DEA Fuel Moisture Content product is provided under a Creative Commons Attribution 4.0 International Licence. This product is provided subject to the Disclaimer of Warranties and Limitation of Liability in section 5 of the Creative Commons Attribution 4.0 International Licence.