DEA Hotspots
DEA Hotspots
Vector product
- Version:
- Type:
Data service, Vector
- Coverage:
27 Aug 2002 to Present
- Data updates:
Every 10 minutes, Ongoing
Important
DEA Hotspots is not to be used for safety of life decisions.
About
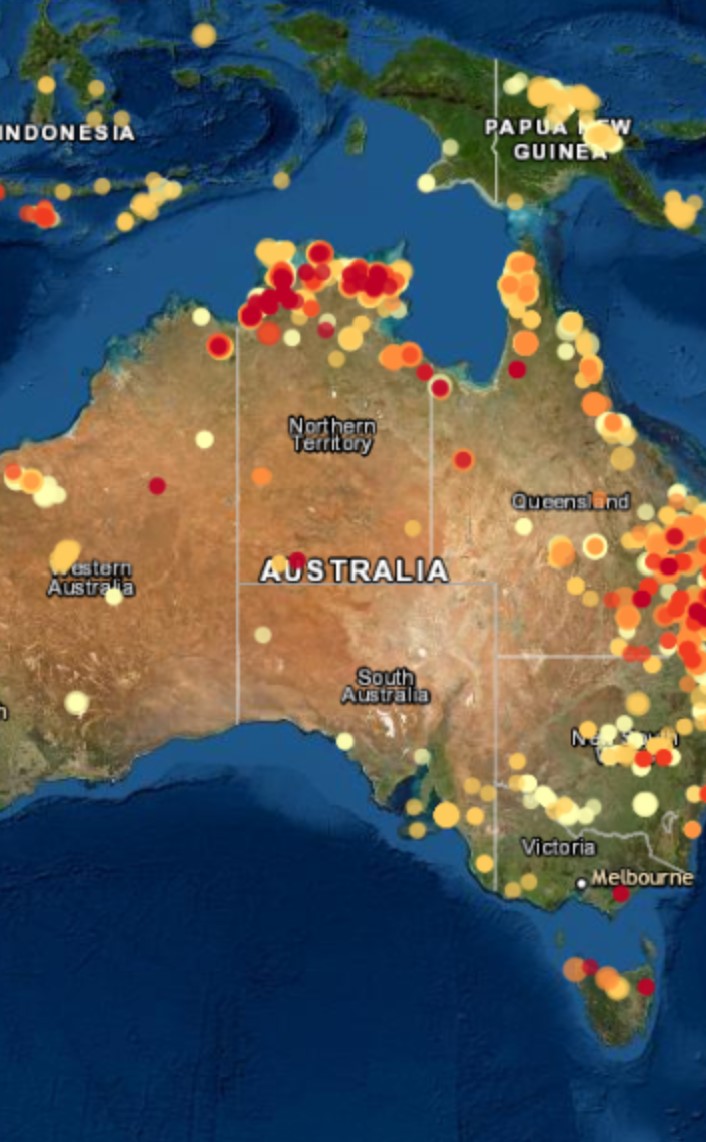
Digital Earth Australia (DEA) Hotspots is a national bushfire monitoring system that uses satellite sensors to detect areas producing high levels of infrared radiation — called Hotspots — to allow users to identify potential fire locations with a possible threat to communities and property.
Access the data
For help accessing the data, see the Access tab.
Key specifications
For more specifications, see the Specifications tab.
Technical name |
Digital Earth Australia Hotspots |
Layers |
|
Catalogue ID |
|
Currency |
|
Licence |
Cite this product
Data citation |
Geoscience Australia, 2020. Digital Earth Australia Hotspots dataset. Geoscience Australia, Canberra. https://pid.geoscience.gov.au/dataset/ga/111881
|
Product Description and documents
Read the Product Description (PDF) for the technical specifications and layers.
Background
Bushfires are a natural part of the Australian landscape. Many of our native flora and fauna have adapted to the specific fire regimes of the regions in which they live.
It is important we are able to accurately map and monitor fires on a near real-time basis. This information allows emergency services to control bushfires and develop risk assessments and disaster relief plans.
What this product offers
Digital Earth Australia (DEA) Hotspots is a national bushfire monitoring system that provides timely information about hotspots to emergency service managers and critical infrastructure providers across Australia. Updated with new information every 10 minutes, the mapping system uses satellite sensors to detect areas producing high levels of infrared radiation (called Hotspots) to allow users to identify potential fire locations with a possible risk to communities and property.
DEA Hotspots is not published in real time and should not be used for safety of life decisions.
There are two versions of the DEA Hotspots system:
DEA Hotspots public version_number: https://hotspots.dea.ga.gov.au/
Available for anyone to access and use
DEA Hotspots secure users’ version_number: https://hotspots.dea.ga.gov.au/login
Available for emergency managers and associated organisations
Provides priority access to the system during periods of high demand
Includes additional sources of Hotspot information
To apply for access, email earth.observation@ga.gov.au
Applications
Hotspots can indicate possible active fires in some circumstances. Taken as an ensemble, Hotspots provide an overview of thermal activity in Australia and capture the pattern of possible fires across the Australian continent over time.
This application allows you to visualise, search and download current and historic Hotspot data for any location Australia-wide.
You can also overlay satellite passes, topography, burnt areas, and other imagery sources such as Sentinel 2 Near Real-Time products.
The system can be used by:
emergency services
Emergency management agencies use Hotspots as one of many operational data feeds to inform their broad situational awareness of, and at times tactical response to, fires.
climate change researchers
the media
policy makers
the broader public
Technical information
Important notes about Hotspots
Each Hotspot is represented by a spot on the map, derived from (a growing number of) satellite-born instruments that detect light in the thermal wavelengths.
Hotspots can indicate possible active fires in some circumstances. Taken as an ensemble, Hotspots provide an overview of thermal activity in Australia and capture the pattern of possible fires across the Australian continent overtime.
Emergency management agencies use Hotspots as one of many operational data feeds to inform their broad situational awareness of, and at times tactical response to, fires.
DEA Hotspots should not be used for safety of life decisions. For local updates and alerts, please refer to your state emergency or fire service.
Hotspots are not presented in real-time and not designed to be used in isolation of other data sources. It is not accurate enough to be relied upon for time-critical detection and location of fires.
The colour of the spot represents the time the Hotspot was last observed by a passing satellite (e.g., 0-2 hours). The colour does not indicate severity.
The size of the Hotspots does not indicate the size of the fire.
If you zoom in on the map you will notice that the size of the Hotspot dot will change.
The Hotspot location on any map (no matter how detailed) is only accurate to ± 375 m at best (VIIRS).
Hotspot data generation
At best, hotspots information is 17 minutes old (this is how long it takes to download and process data into hotspots after each satellite pass).
The Himawari-9 satellite is a geostationary satellite, which covers Australia at all times, and provides updates every 10 minutes, however the information is not published in real time.
All other satellites pass over a given area up to 4 times a day, and each pass covers only a part of Australia, which means some fires are not detected because the satellite was not looking over that area at the appropriate time.
Thermal infrared sensors on-board the satellites can detect areas with unusually high temperatures. We call these areas Hotspots.
Satellites and sensors
DEA Hotspot sources include the:
Moderate Resolution Imaging Spectroradiometer (MODIS) sensor on the National Aeronautics and Space Administration (NASA) Aqua polar orbiting satellite.
Visible Infrared Imaging Radiometer Suite (VIIRS) on the Suomi National Polar orbiting Partnership (NPP) satellite, NOAA-20, and NOAA-21 polar orbiting satellites.
Advanced Himawari Imager (AHI) sensor operated by the Japan Meteorological Agency (JMA) on the Himawari-9 geostationary satellite.
Accuracy
Quality assurance
False positives (showing a Hotspot without an underlying cause) are possible.
False negatives (failing to show a Hotspot, despite a heated land surface, fire, etc.) are possible.
Hotspots are potential bushfires, but could also indicate other phenomena, such as gas fires, heavy industry, furnaces, smoke plumes, jet contrails and hot rocks.
Not all fires will be detected as Hotspots.
The Hotspot location on any map (no matter how detailed) is only accurate to ± 375 m at best (VIIRS).
Hotspots are not presented in real-time and not designed to be used in isolation of other data sources. It is not accurate enough to be relied upon for time-critical detection and location of fires.
Geostationary satellite derived products algorithms may be optimised for day or night conditions. For algorithms such as BRIGHT that provide hotspots every 10 minutes, 24 hours per day, temporal windows approximately +/- 1 hour of sunset and sunrise are considered unreliable periods.
No Hotspots are produced if satellite data is not received (e.g. for AHI, 0240 and 1440 UTC times are not received).
Hotspots should not be used for safety of life decisions. For local updates and alerts, please refer to your state emergency or fire service.
Depending on the sensor, generally, a flaming or smouldering fire would need to be at least 1,000 m2 to be recognised as a Hotspot. Under exceptional (and rare) conditions (no cloud, smoke, wind etc), a flaming fire at 50m2 may be detected. However, fires are often smaller than the size of the satellite pixel.
Missing Hotspots
Hotspots may be obscured or missing from the map due to the following reasons:
Polar Orbiting satellites are not designed to provide live updates on fire fronts, as they only look over the fire ground 4-7 times per day.
Optical satellites cannot see though clouds, heavy smoke or tree canopy.
Fires may be missed if they are relatively small or do not cover a spatial footprint large enough to be detected by the sensors (e.g. the MODIS footprint is 1km2).
Cool fires are not likely to be detected.
Sensors can be inoperable for extended periods of time, disrupting the detection of Hotspots.
The fire may have been burning during a time when no satellite was looking over the fire ground.
Known Issues
13 May 2024: Terra-derived DEA Hotspots are unavailable
Direct Broadcast satellite downloads from the Terra satellite have again become unavailable. This means that Terra-derived DEA Hotspots are unavailable until further notice.
This is due to the TERRA MODIS satellite experiencing power problems. The satellite continues to collect data but its direct broadcast has stopped.
Layers
Vector products contain one or more distinct layers of data, and each layer can contain multiple attribute fields.
Hotspot
The attributes and metadata included with each Hotspot vary according to the access mechanism used to interact with the Hotspot information. E.g., the Hotspots portal contains a subset of these attributes, while the Geoscience Australia Historic Hotspot database (the Historic database) contains the full metadata record for each Hotspot.
Type |
Units |
Description |
|
|---|---|---|---|
ID |
- |
- |
Numeric ID assigned to the Hotspot. |
Satellite |
- |
- |
Name of the satellite platform that is carrying the sensor used to acquire the satellite data for hotspots calculation (e.g., Aqua, Suomi NPP, NOAA-20, NOAA-21). |
Satellite_nssdc_id |
- |
- |
National Space Science Data Centre (NSSDC) unique satellite number. Learn more |
Satellite_operating_agency |
- |
- |
Name of the agency providing the satellite data (e.g., NASA). |
Sensor |
- |
- |
Name of the sensor used to detect the Hotspot (e.g., MODIS, VIIRS, AHI). |
Orbit |
- |
- |
The orbit number is determined using the information provided in the NORAD Two Line Element (TLE) file(s). The TLE file provides reference information foran “epoch” orbit that allows the current orbit to be calculated using the acquisition information. A value of -1 indicates the orbit is not reported. |
Start_dt |
- |
- |
Start date and time (in UTC) of the satellite pass acquisition. |
Stop_dt |
- |
- |
Stop date and time (in UTC) of the satellite pass acquisition. Note that Himawari-9, NOAA-20, and Suomi NPP do not have Stop_dt information. |
Filename |
- |
- |
File name that the Hotspot is contained in and uses the following format: satellite_dateUTC_Hotspot.txt |
Process_dt |
- |
- |
Date and time (in UTC) that the Hotspot was processed (file creation time). |
Process_algorithm |
- |
- |
The name of the algorithm used to producethe Hotspot (e.g., MOD14, AFIMG, BRIGHT AHI). |
Process_algorithm_version |
- |
- |
Algorithm version number used to produce the Hotspot. |
Product |
- |
- |
Name of the product within the database (e.g., LANDGATE_AHI, MOD14). |
Load_dt |
- |
- |
Date and time (in UTC) that the Hotspot was loaded into the database. |
Latitude |
- |
Signed decimal degrees |
Hotspot latitude is based on WGS84 (º). (For more information, see the Product Description.) |
Longitude |
- |
Signed decimal degrees |
Hotspot longitude is based on WGS84 (º). (For more information, see the Product Description.) |
Temperature |
- |
Degrees Kelvin |
To detect the presence of a Hotspot, a set of detection criteria has been developed. (For more information, see the Product Description.) |
Power² |
- |
Megawatt (MW) |
(For more information, see the Product Description.) |
Confidence |
- |
None (scalar value) |
The Confidence attribute is intended to help users to gauge the quality of individual fire pixels within the fire mask. GA displays and provides all Hotspots, regardless of confidence. Users can choose to filter on the confidence attribute, according to their use case. (For more information, see the Product Description.) |
Datetime |
- |
- |
Time of acquisition for the data in which the Hotspot was detected (UTC). This is determined based on the start and end time of the acquisition. For the current satellites the level of accuracy should be of the order of 5 mins. (For more information, see the Product Description.) |
Australian_state |
- |
- |
State that the Hotspot was captured in (e.g., NSW, ACT, WA, NT, VIC, TAS, QLD, SA). |
Hours_since_hotspot |
- |
- |
Hours since hotspot detection – only provided with web service access, and only correct at time of access. |
Accuracy |
- |
- |
Accuracy of the Hotspot detection based on the resolution of the satellite used. |
For more information on these layers, see the Product Description.
Product information
This metadata provides general information about the product.
Short name |
DEA Hotspots |
The name that is commonly used to refer to the product. |
Technical name |
Digital Earth Australia Hotspots |
The full technical name that refers to the product and its specific provider, sensors, and collection. |
Version |
1.0.0 |
The version number of the product. |
Lineage type |
Data service |
Our standard lineage types are ‘Baseline’ and ‘Derivative’. |
Spatial type |
Vector |
Vector data consists of spatial polygons, lines, and points. |
Temporal coverage |
27 Aug 2002 to Present |
The time span for which data is available. |
Coordinate Reference System (CRS) |
The method of mapping spatial data to the Earth’s surface. |
|
Update frequency |
Every 10 minutes |
The expected frequency of data updates. Also called ‘Temporal resolution’. |
Update activity |
Ongoing |
The activity status of data updates. |
Currency |
Currency is a measure based on data publishing and update frequency. |
|
Latest update date |
See Table A of the report. |
|
Catalogue ID |
The Data and Publications catalogue (eCat) ID. |
|
Licence |
See the Credits tab. |
Product categorisation
This metadata describes how the product relates to other products.
Tags |
Access the data
DEA Maps |
Learn how to use DEA Maps. |
|
Data sources |
Learn how to access the data via AWS. |
|
Web services |
Learn how to use DEA’s web services. |
|
Read the documents |
Read the Product Description (PDF) for the technical specifications and layers. |
Use constraints
DEA Hotspots is not to be used for safety of life decisions.
The information displayed on DEA Hotspots (the “Service”) is for general informational purposes only, and is not intended to provide any commercial, financial, or legal advice.
Please see the Geoscience Australia website for the full disclaimer notice.
Access the DEA Hotspots product description
The latest version of the DEA Hotspots product description is available in the DEA Hotspots AWS documents files folder.
Look for the file named “Product Description”. This document contains information about:
How to access DEA Hotspots
How to register for the secure DEA Hotspots site
DEA Hotspots algorithm details
How to access historical DEA Hotspots information
Version history
No previous versions are available.
Changelog
23 May 2025: NOAA-19-derived DEA Hotspots discontinued from 16 June 2025
The National Oceanic and Atmospheric Administration (NOAA) has announced the discontinuation of data collection from the NOAA-19 satellite from 16 June 2025. The satellite’s Advanced Very High-Resolution Radiometer (AVHRR) is currently used for capturing thermal anomalies and providing a night-time overpass for DEA Hotspots under the Landgate AVHRR layer which will no longer be available from this date.
No action is required. Users can prepare by transitioning to the Visible Infrared Imaging Radiometer Suite (VIIRS) Hotspots and Himawari-9 Hotspots which remain available. VIIRS Hotspots from Suomi NPP, NOAA-20, and NOAA-21 are available and provide coverage in the afternoon and night-time, whilst Himawari-9 Hotspots are updated continuously every ten minutes.
19 Dec 2024: NOAA-21-derived DEA Hotspots are now available
Following our communication in November regarding changes to the Hotspots service, we are pleased to advise that Hotspots derived from the Visible Infrared Imaging Radiometer Suite (VIIRS) sensor onboard NOAA-21 are now available. NOAA-21 currently passes over Australia at approximately 3pm and 2am Australian Eastern Standard Time, increasing the density and reliability of the afternoon and nighttime observations.
In the Hotspots application, the NOAA-21 feed is off by default. You can include either the VIIRS ‘AFIMG NOAA-21’, or ‘AFMOD NOAA-21’ Hotspots algorithms as additional layers in the Hotspots map interface by selecting these layers from the VIIRS menu in the legend.
18 Nov 2024: DEA Hotspots — Enhancing Bushfire Monitoring with New Satellite Data
We are writing to keep you informed of changes that are occurring to the DEA Hotspots service. While faced with the loss of the MODIS Terra for our morning observations, we can continue to use available satellites to bolster the density and reliability of our afternoon observations. Data from the Visible Infrared Imaging Radiometer Suite (VIIRS) sensor onboard NOAA-21 will be available in DEA Hotspots by early December 2024. Once NOAA-21 data is available, a tech alert will be issued to users.
License and copyright
© Commonwealth of Australia (Geoscience Australia).
Released under Creative Commons Attribution 4.0 International Licence.