2026-01-23 HALL: CSIRO Hall, Landsat 8 overpass
This is a report of the field data collected on 23 January 2026 at the location of CSIRO Hall to validate the satellite data of the Landsat 8 overpass. The full collection of data is contained in the National Spectral Database. Satellite data can be found on DEA maps. An explanation of how to read these reports can be found on the Daily Validation Summary Reports page.
Variables
These variables and environmental factors were present on the day the data were collected.
Instrument(s) used |
SR-3500_20680T1 |
Time of field site measurements (UTC) |
2026-01-23 01:28:28 to 2026-01-23 01:58:23 |
Time of overpass (UTC) |
2026-01-23 23:56:35 |
GPS quality |
Good |
Reference position |
149.066E, 35.18213333S (WGS84) |
Matchup quality |
Mediocre |
Surface Reflectance Results
The surface reflectance statistics collected on this day are grouped into bands. This allows the data to be used to validate Geoscience Australia’s other datasets that use the same standardised bands.
Band |
Sat Mean |
Sat rms |
Field mean |
Field rms |
CA |
0.058 |
0.004 |
0.082 |
0.008 |
blue |
0.079 |
0.005 |
0.103 |
0.01 |
green |
0.119 |
0.008 |
0.142 |
0.013 |
red |
0.163 |
0.012 |
0.187 |
0.017 |
NIR |
0.276 |
0.009 |
0.291 |
0.023 |
SWIR1 |
0.416 |
0.023 |
0.444 |
0.037 |
SWIR2 |
0.278 |
0.02 |
0.311 |
0.033 |
Figures
The following figures provide visual representations of the surface reflectance data. (Click a figure to view it at full size.)
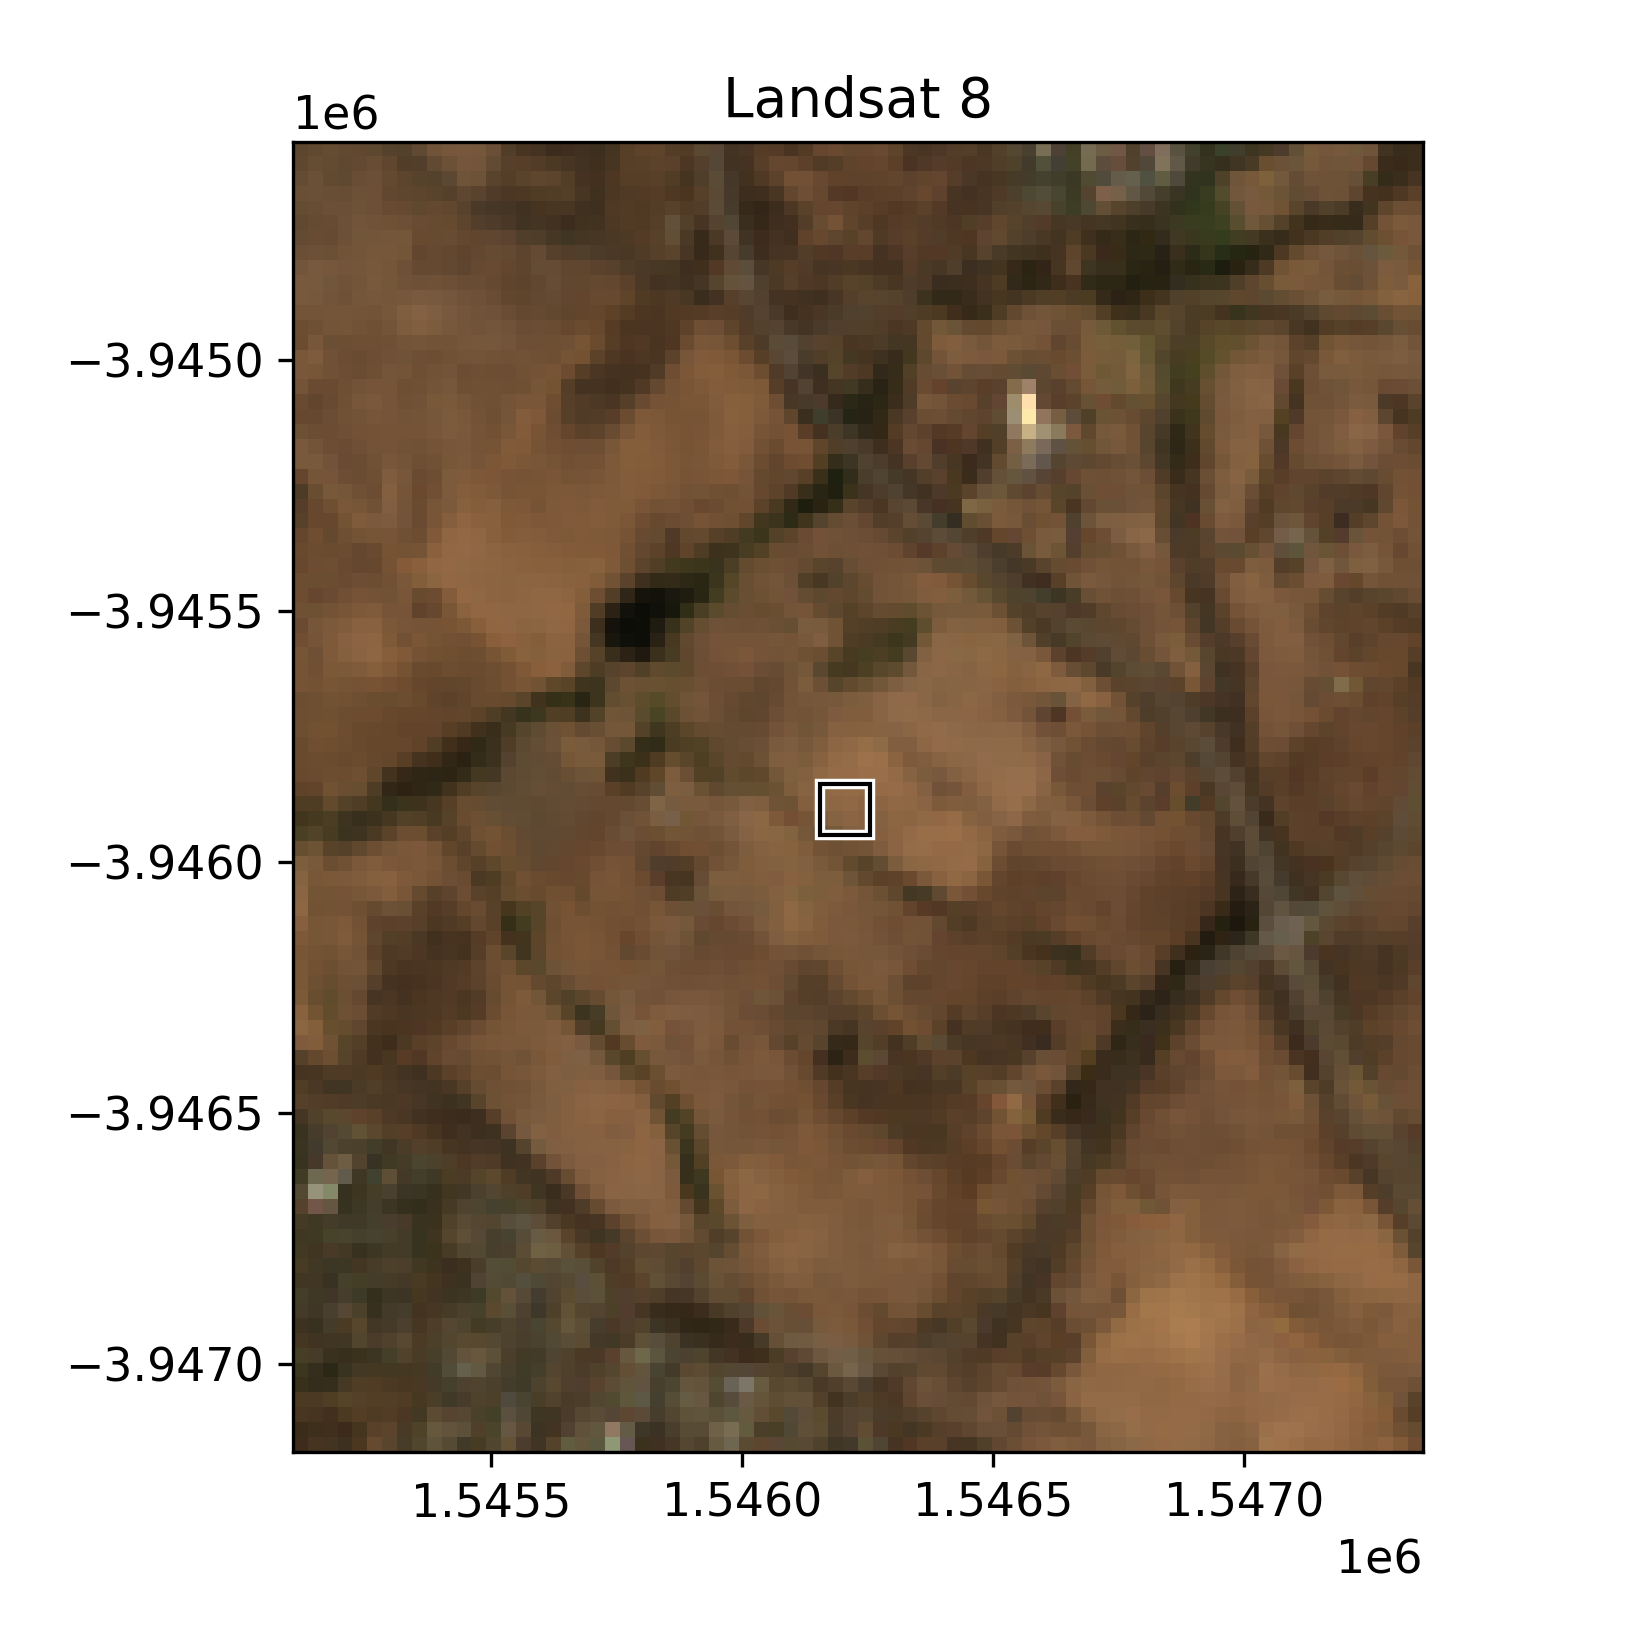
A satellite imagery tile of true colour (RGB) surface reflectance. It covers an area of approximately 2 km × 2 km. The white box indicates the size and location of the field site.
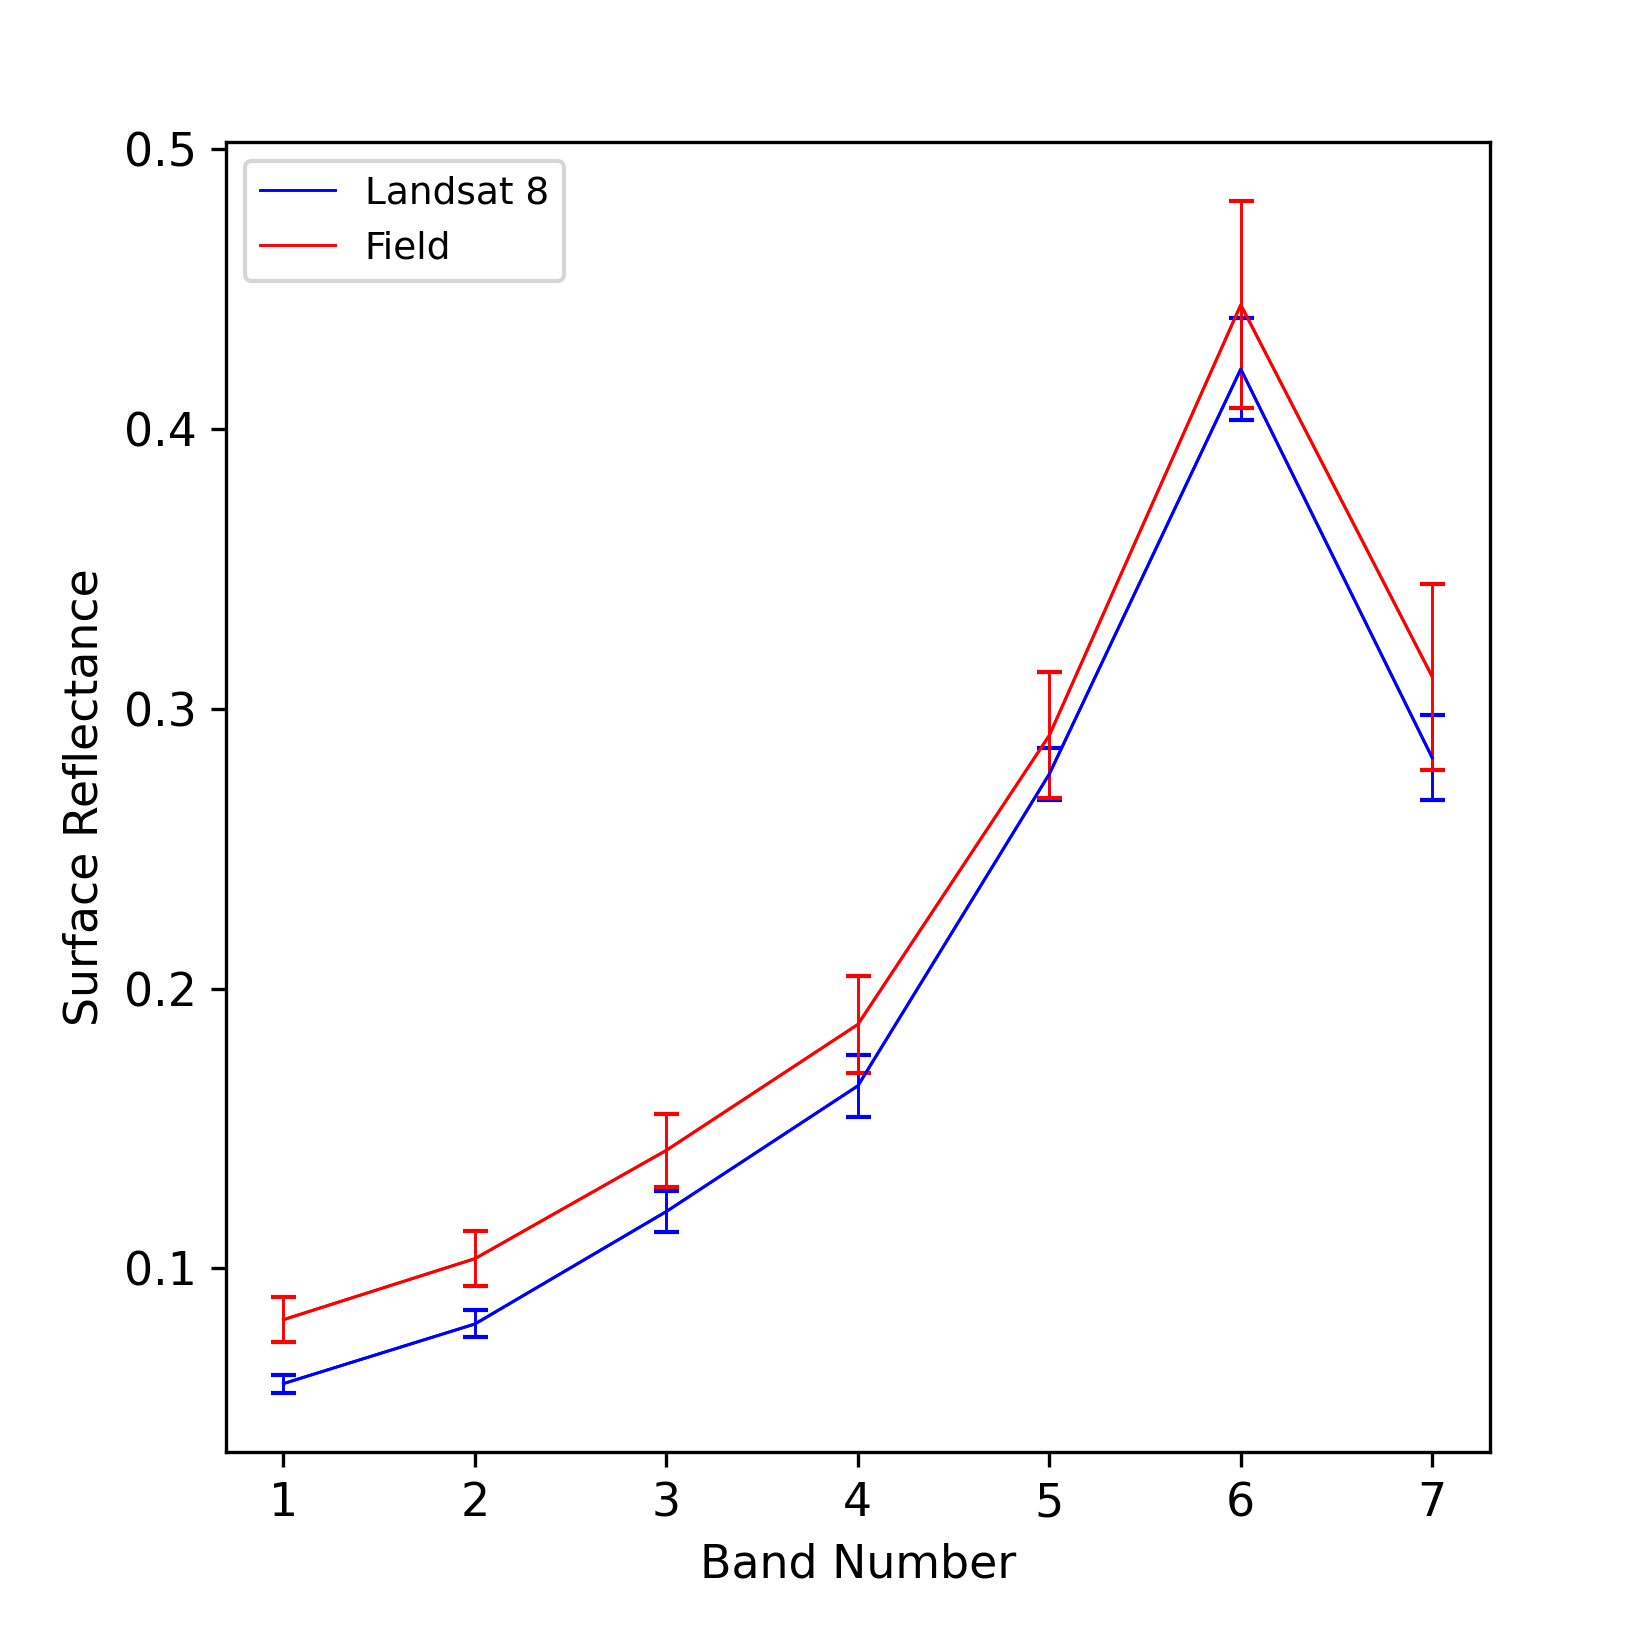
A band-by-band plot of surface reflectance for satellite and field data. Satellite uncertainty error bars for each band are the standard deviation of pixel values over and surrounding the field site. Field uncertainty error bars are the standard deviation of values after averaging all spectra within the same satellite pixels.
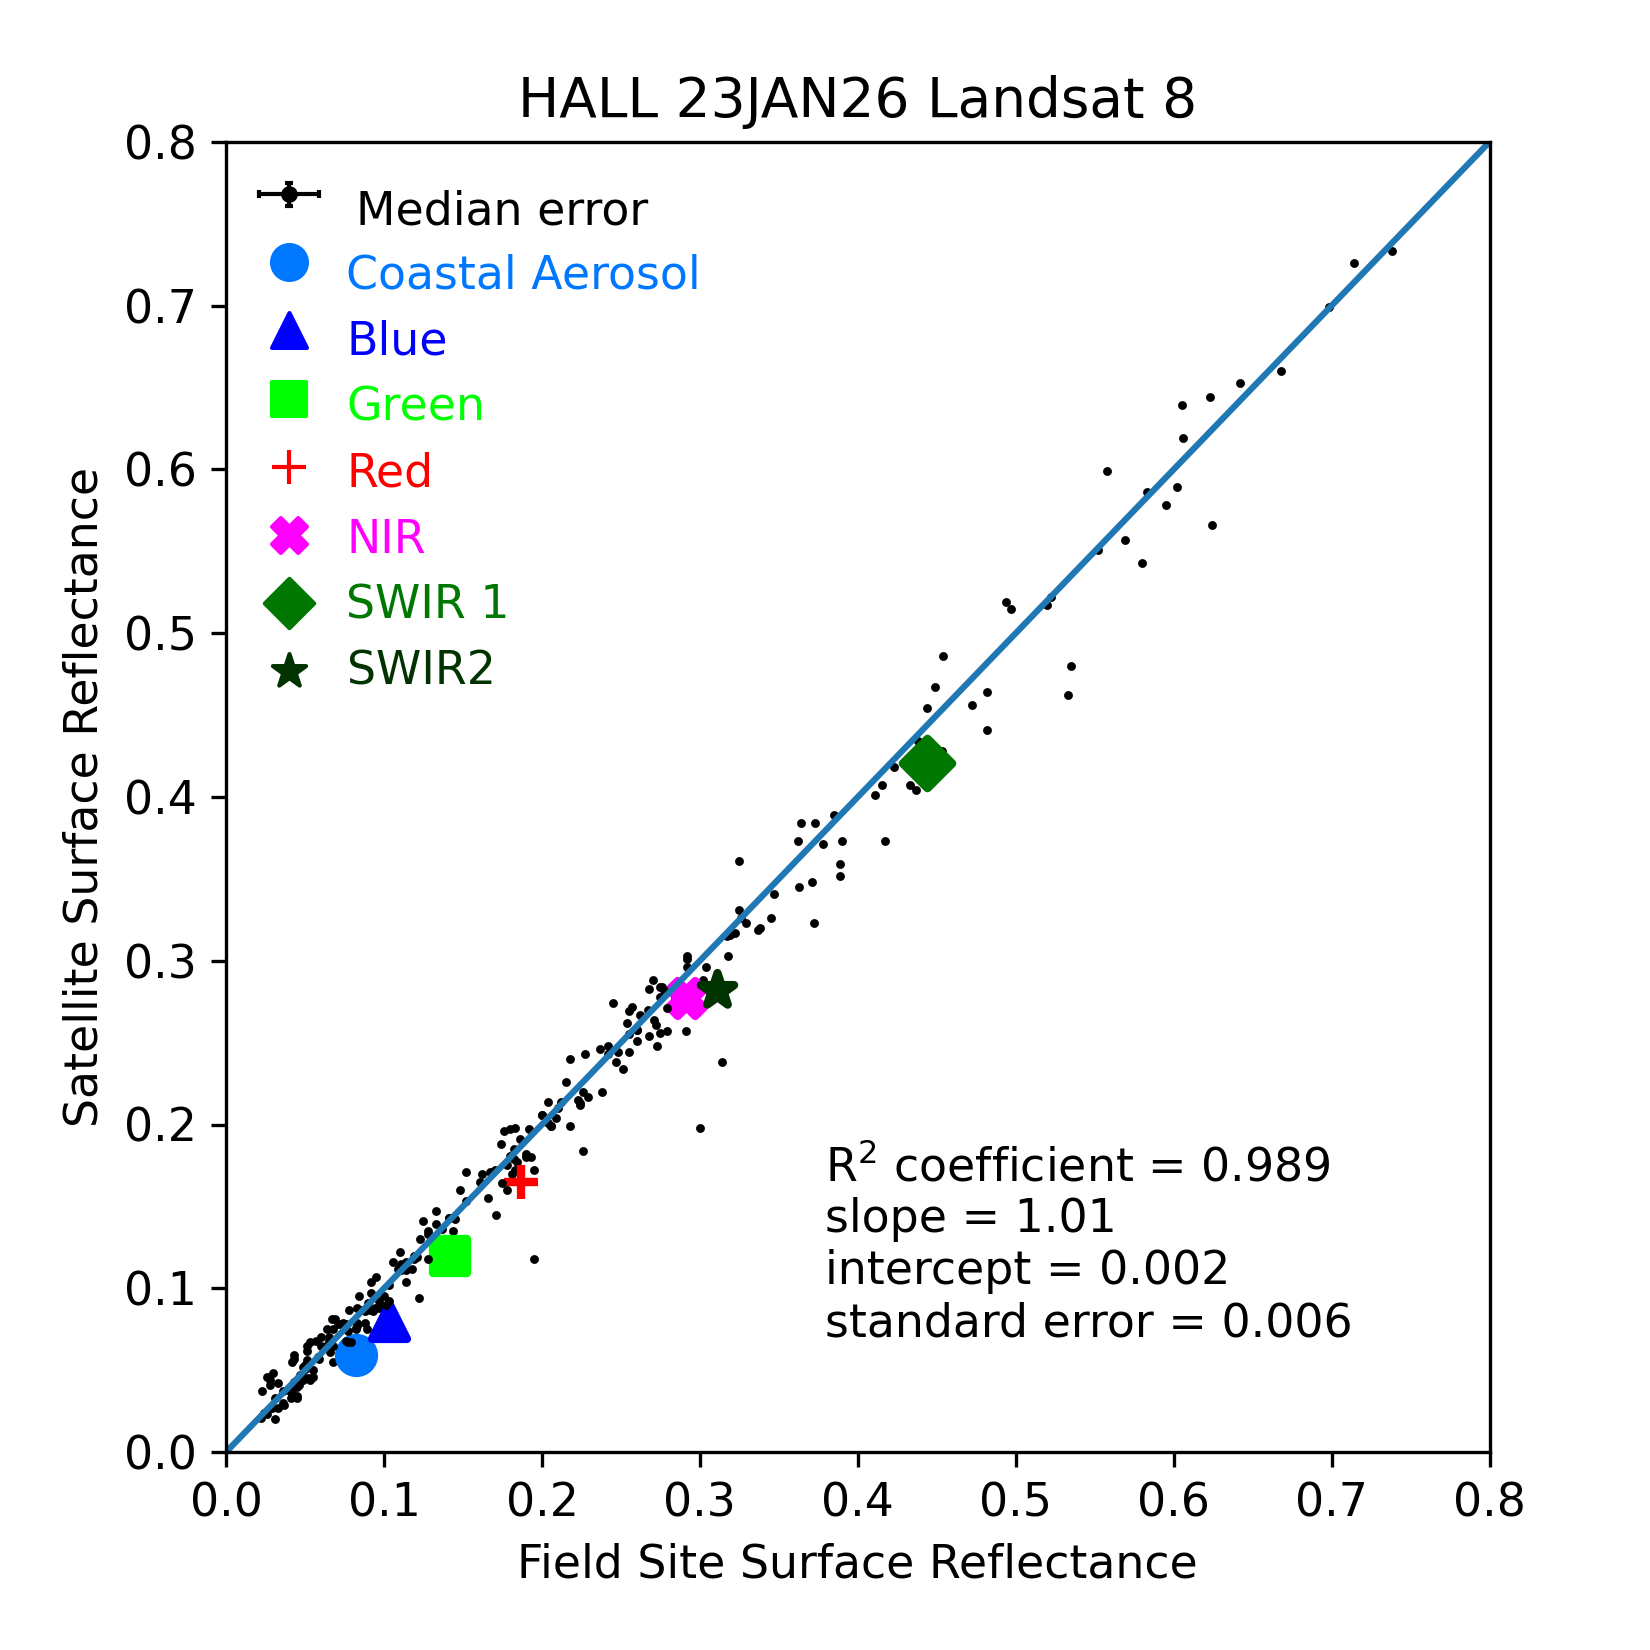
A plot of Satellite Surface Reflectance versus Field Site Surface Reflectance on this day. The solid line represents the one-to-one equality between field and satellite measurements. The black dots are the values from all field site measurements prior to this date. The line of best fit is not shown, but its parameters are given in the bottom-right corner.
Fractional Cover
A more detailed description of these results can be found at Daily Validation Summary Reports.
DEA Fractional Cover (FC) is a derivative product, based on measured surface reflectance. Here, we apply the same processing to the field measurements to compare the satellite- and field-derived FC values. Please note, this is not validation of DEA Fractional Cover, but rather quantifying the differences between field and satellite measurements an their impact on derivative products. There is currently no FC product based on Sentinel measurements, so we only validate Landsat-derived FC. The following figures provide a comparison of FC derived from Landsat and field data, where available. (Click a figure to view it at full size.)
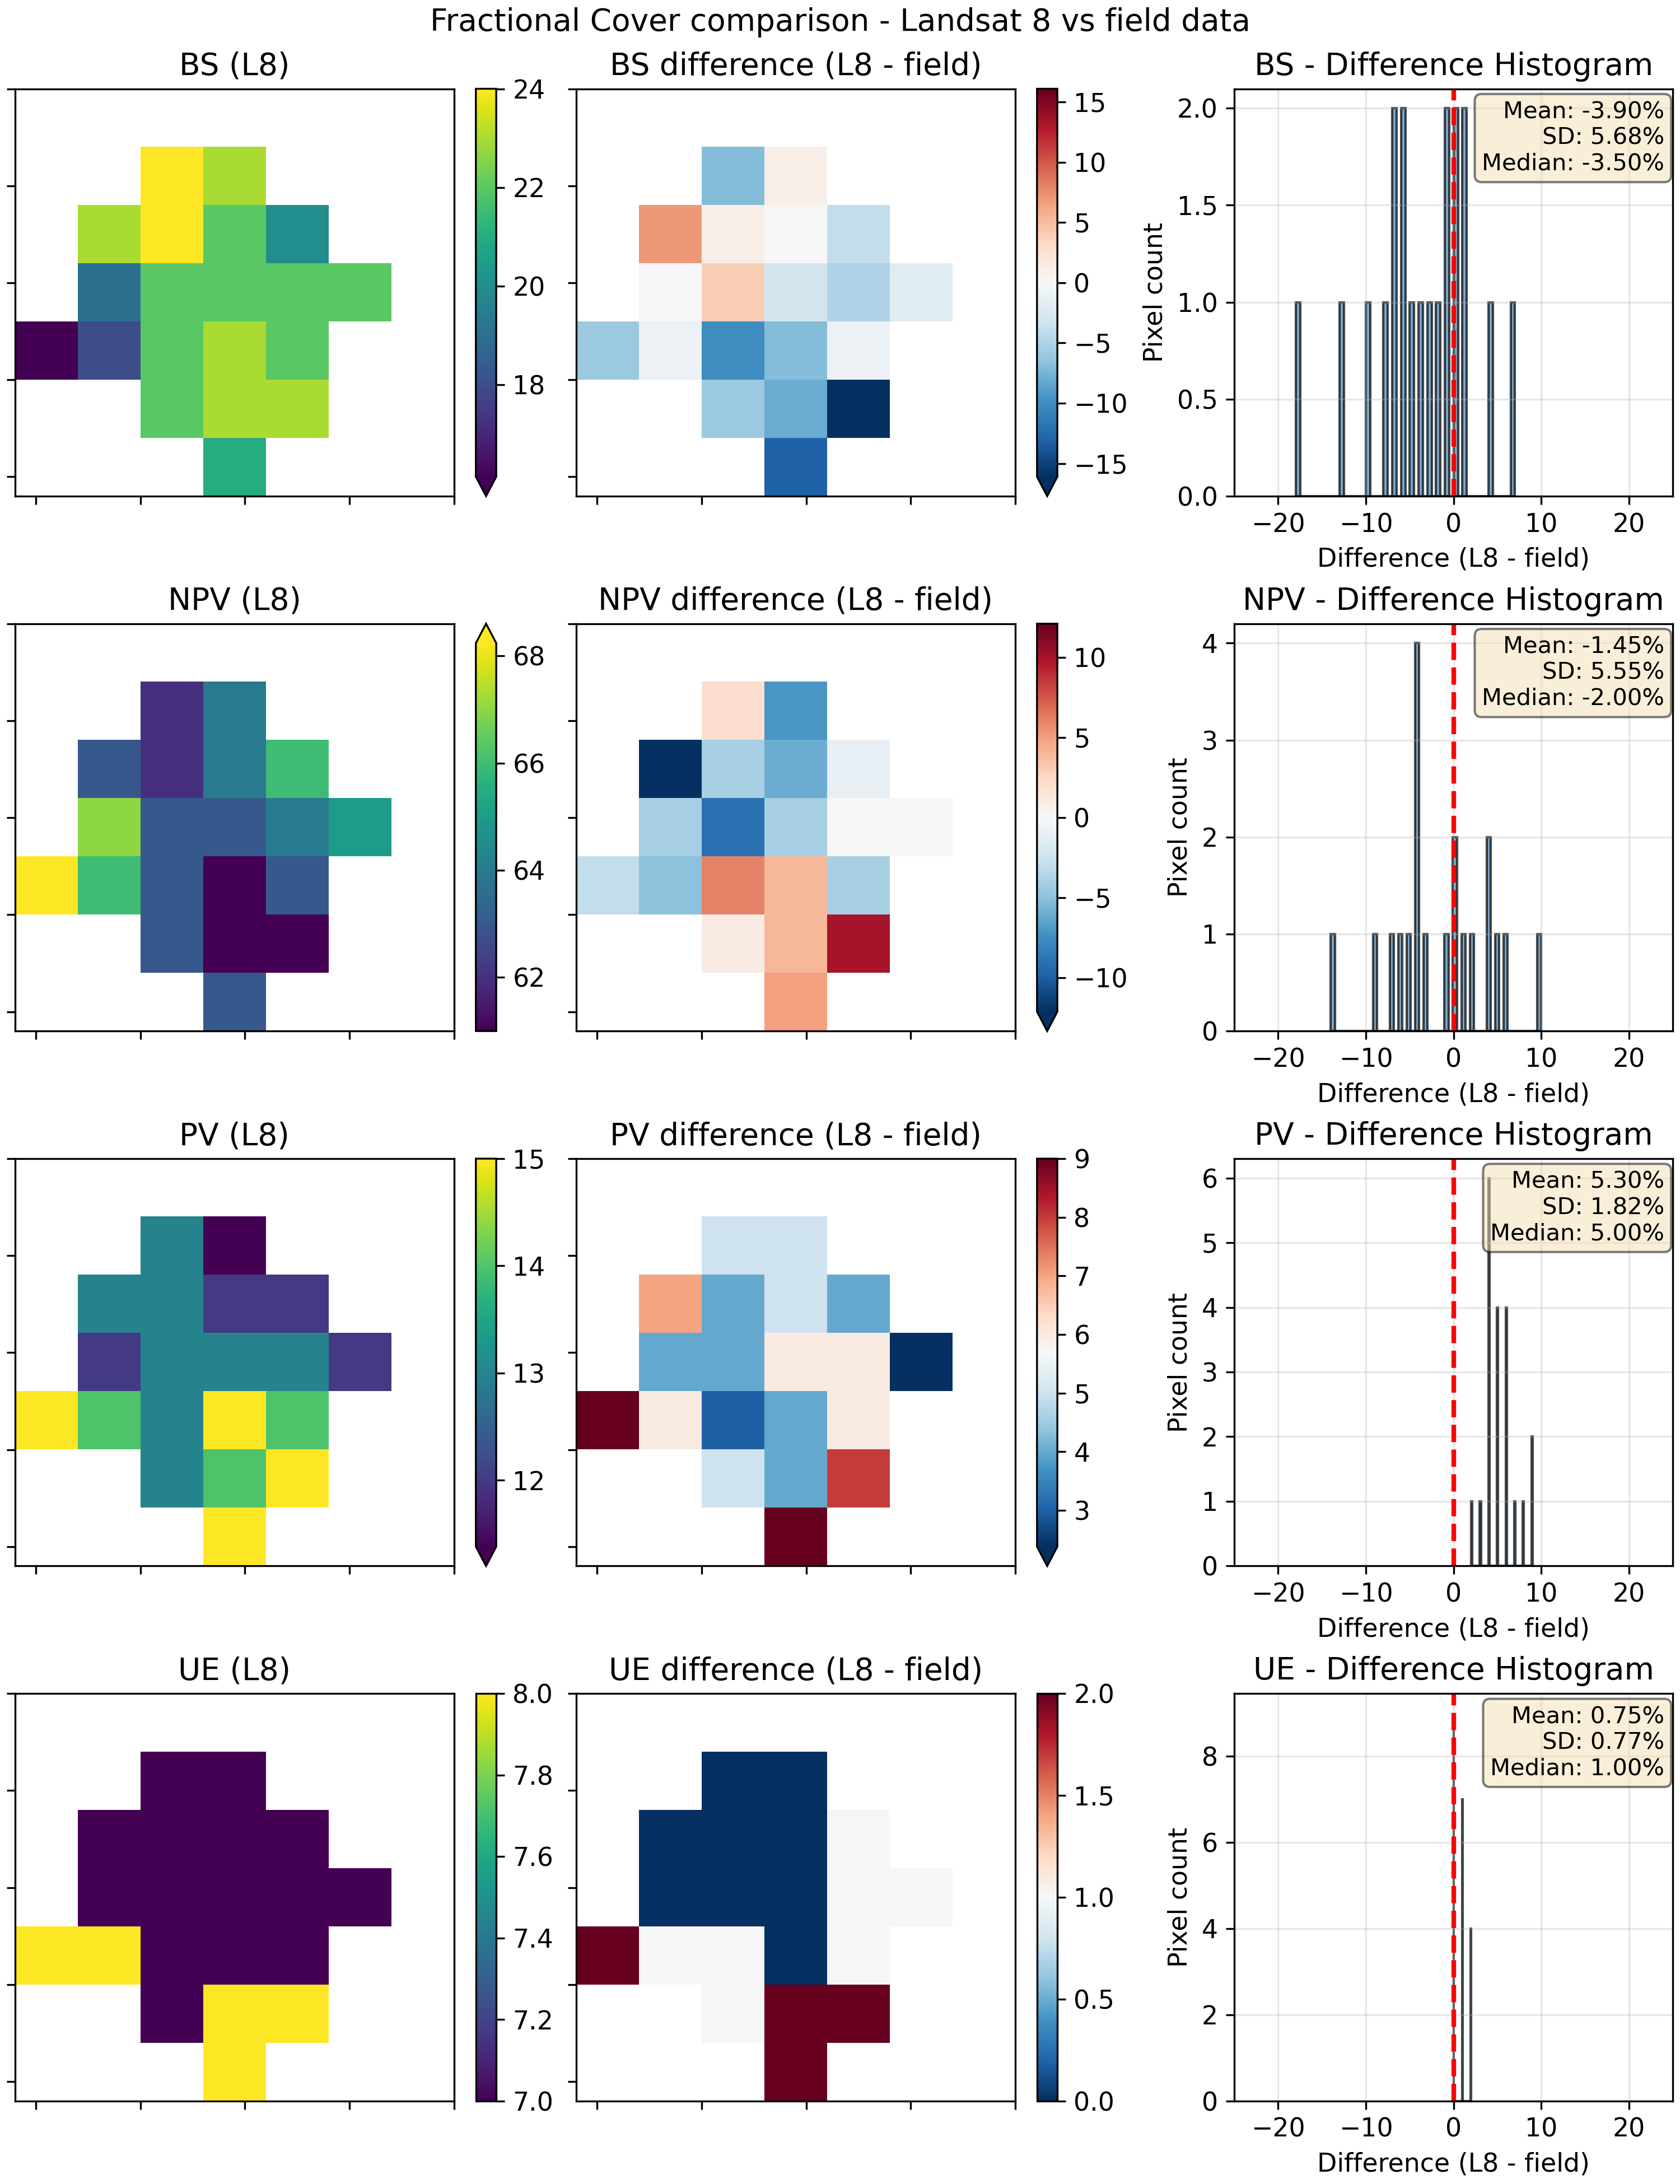
Rows show results for Bare Soil (BS), Non-Photosynthetic Vegetation (NPV), Photosynthetic Vegetation (PV) and Unmixing Error (UE), respectively. The left column shows the range of FC values, on a pixel-by-pixel basis, using the satellite data. The middle panels show the difference between satellite- and field-derived FC values. The right panels show a histogram of differences, together with summary statistics for the field site.
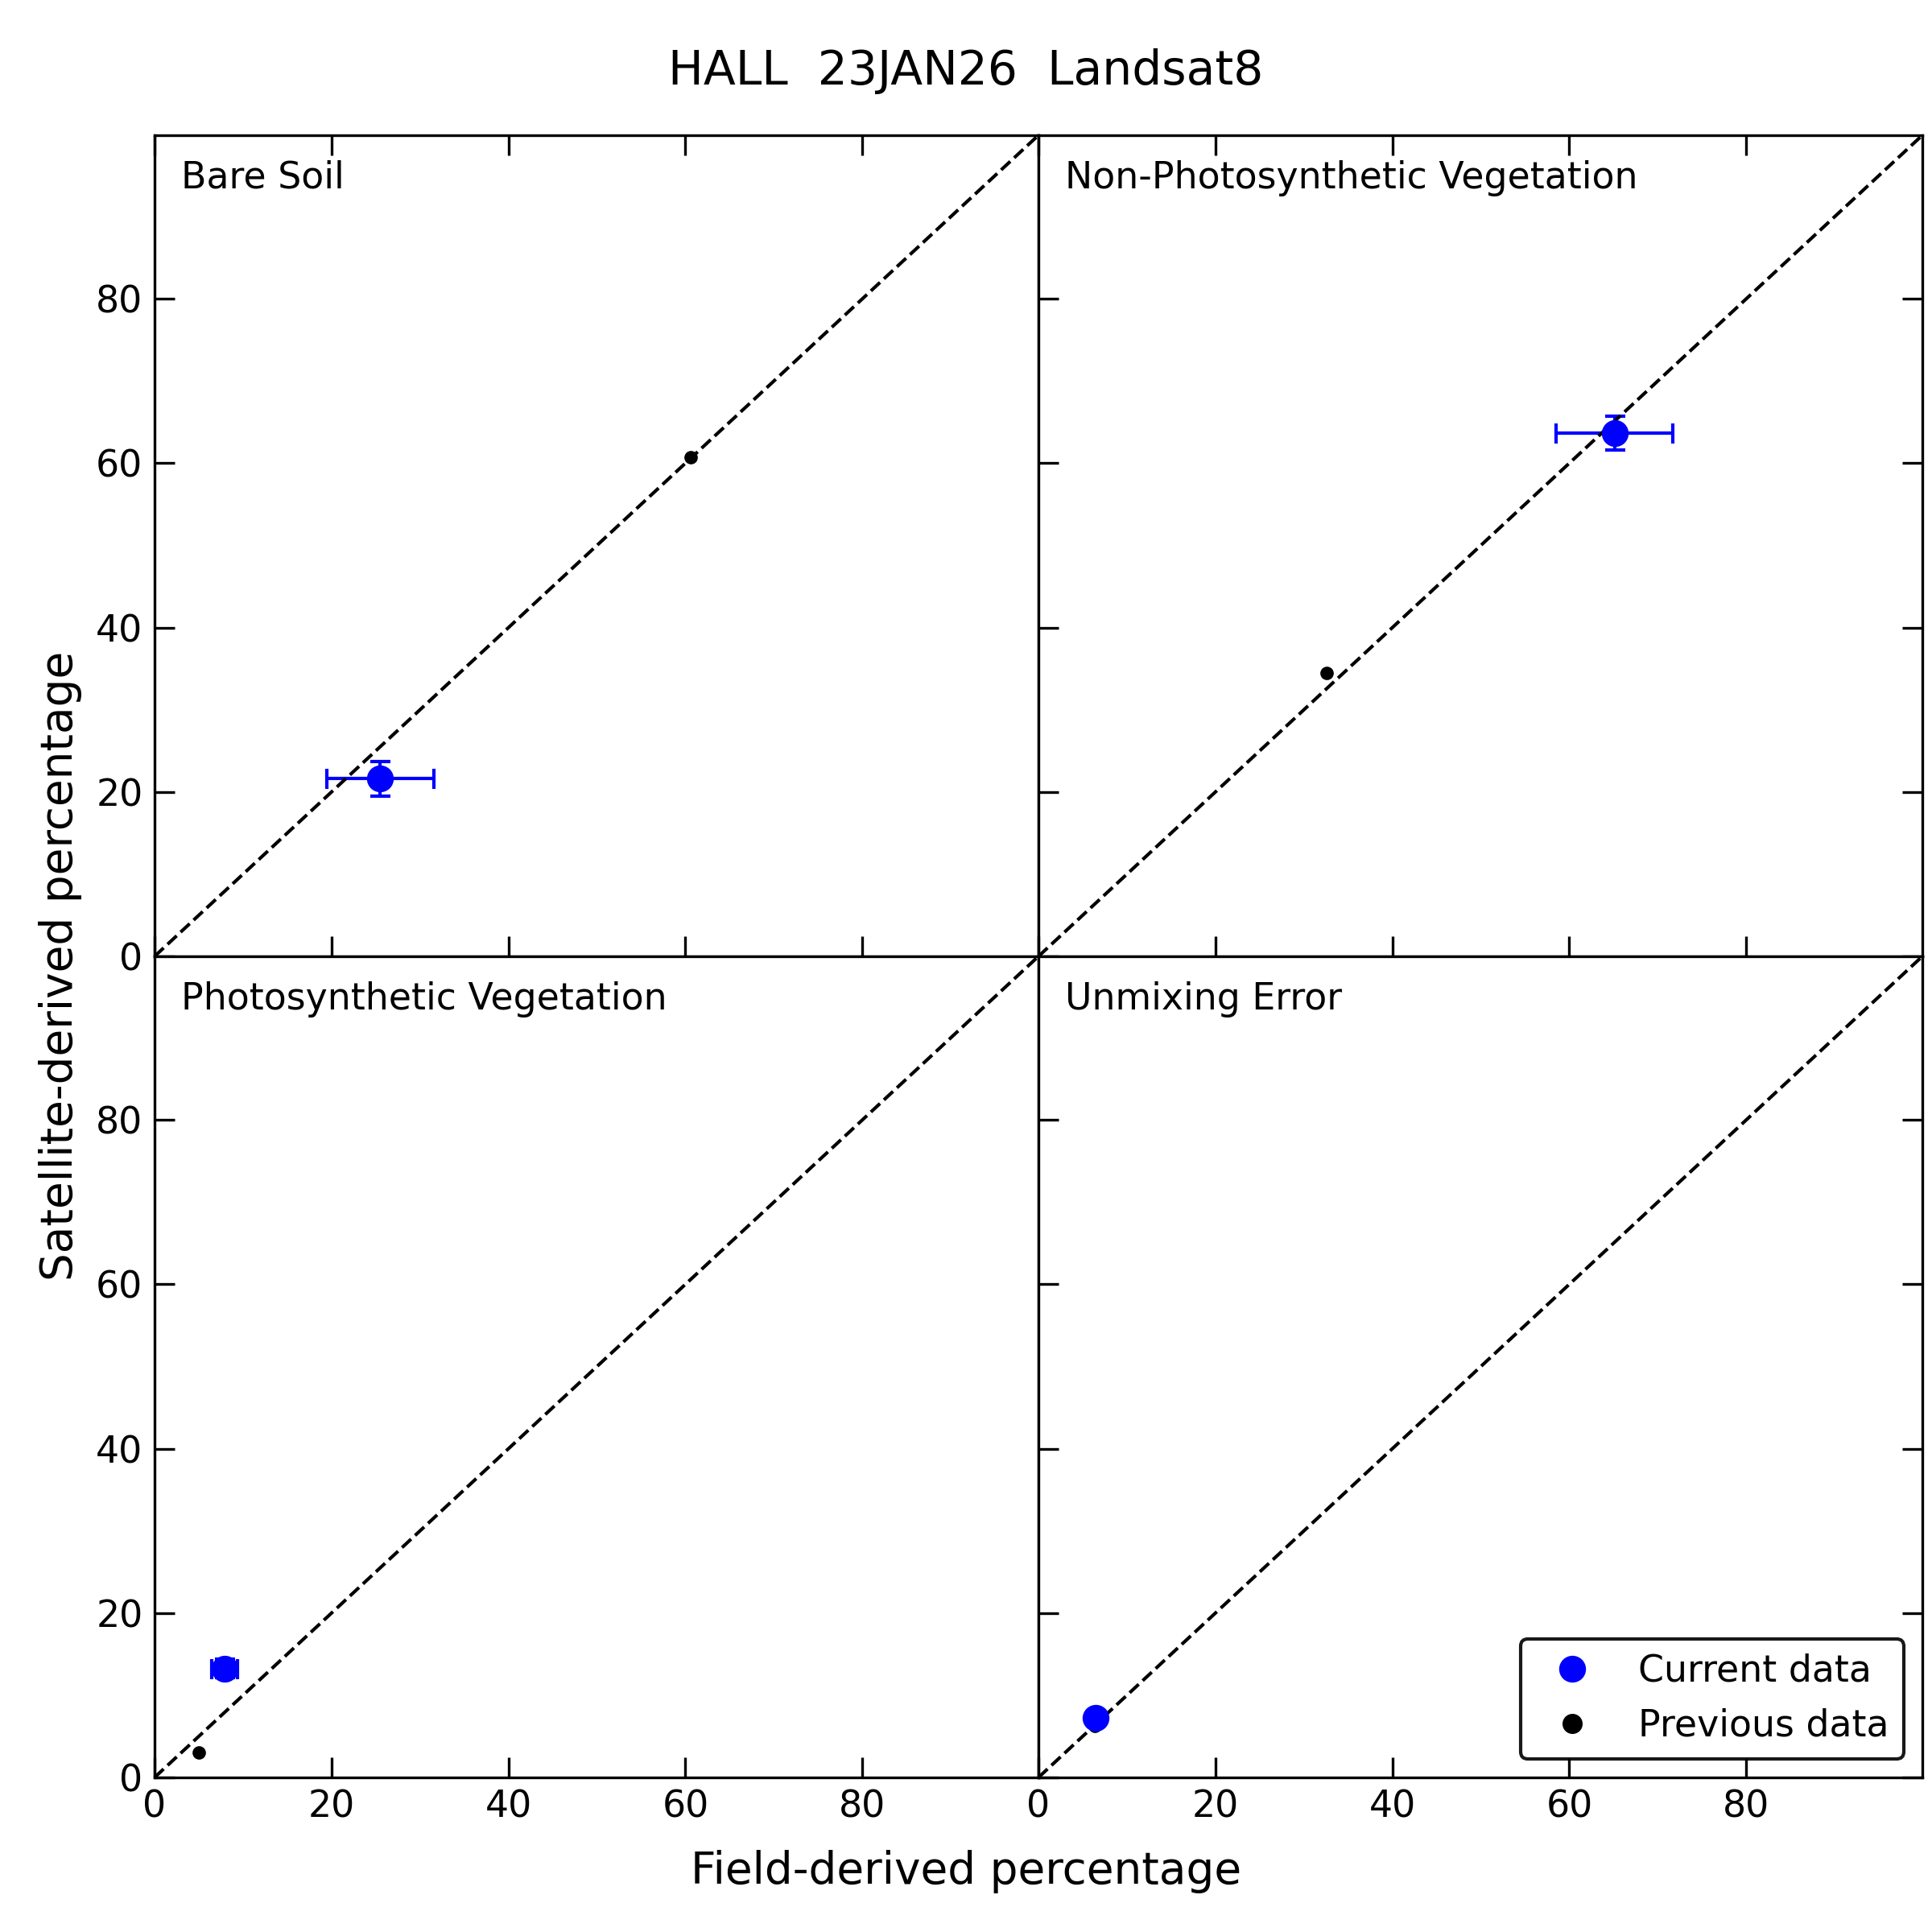
The four panels show FC values for today (blue) and previous (black) field site measurements. The solid line represents that one-to-one equality between field and satellite measurements. Error bars are shown with today’s data, which represent the variation in the pixel values over the field site.