Daily Validation Summary Reports
The Daily Validation Summary Reports provide a comparison of DEA’s satellite-derived Analysis Ready Data (ARD) with field-derived surface reflectance data, as a way to validate the ARD.
Get started
View the Daily Validation Summary Reports
Introduction
A Daily Validation Summary Report gives a summary of the results from a single comparison of ground-based (or occasionally drone-based) data with satellite-based overpass data. The Landsat 8/9 and Sentinel-2A/-2B/-2C satellite data is used. DEA’s Surface reflectance products (i.e. NBAR/NBART) are used for these comparisons. This comparison of field vs satellite data can be evaluated alongside the Daily Validation Summary Reports of previous days.
Here’s one example of a Daily Validation Summary Report: 2023-07-25.
This guide will help you understand each of the sections of this report and the data it contains.
Title
The title of the report contains some key details for you to note. Here’s an example:
2023-07-25: Mullion, Sentinel-2A overpass
The title contains the following details.
2023-07-25— The date that the field data was collected.Mullion— The name of the field site where the data was collected.Sentinel-2A overpass— The name of the satellite or dual satellites which provided the satellite data.
Variables
These are the variables and environmental factors that were present on the day the data were collected. Here is an explanation of each of these variables.
Instrument(s) used — A description of the field instrumentation (including serial numbers, where applicable) used to capture the Surface Reflectance data. Example:
ASD FR4 (18179/3)Time of field site measurements (UTC) — The time that the first field site spectrum was collected as well as the time that the last field site spectrum was collected. The dates use the format:
YYYY-MM-DD HH:MM:SS. (Note that the times are in UTC and therefore, given typical satellite overpass times, the calendar day for local time may be ahead of the calendar day in UTC.) Example:2023-11-26 22:37:46 to 2023-11-26 23:37:06Time of overpass (UTC) — The expected time of the satellite overpass at the location of the field site, in UTC. Uses the same date-time format as above. Example:
2023-11-27 00:45:46GPS quality — A status that represents whether the GPS units are reliable and have provided complete location data. The possible statuses are:
Good— The GPS locations for all spectra are reliable to within 5 m.Poor— The GPS data is only intermittently reliable.None— The GPS data could not be used and coordinates for field measurements have been manually estimated.
Reference position — The GPS coordinates (or estimated coordinates) for the location of the first spectrum taken as a measurement in the field. Example:
142.1036962E, 31.8135401S (WGS84)Matchup quality — A status that represents how closely how the bands match between the field measurements and satellite measurements. The possible statuses are:
Excellent— All bands match within the error bars.Good— Most bands match within the error bars.Mediocre— Few (\(\leq\) 50%) bands match within the error bars.Poor— No bands match within the error bars.
Results
These are the surface reflectance statistics collected on this day, grouped into bands. Here is an explanation of each column of the results table.
Band — An abbreviated name for each Surface Reflectance band of the data. For instance,
CAindicates the Coastal Aerosol band.Sat Mean — The mean satellite surface reflectance.
Sat rms — The 1-sigma rms (root mean square) uncertainty in the satellite surface reflectance. This is calculated by looking at the rms variance of each satellite pixel that is at least partially within the field site.
Field mean — The field data mean surface reflectance.
Field rms — The 1-sigma rms uncertainty in the field surface reflectance. This is calculated by first averaging each individual spectrum contained within a single satellite pixel and then calculating the rms variance of each pixel-averaged value.
Figures
The figures provided in this report are as follows.
Figure 1 — A 2 km \(\times\) 2 km box surrounding the field site in true-colour RGB. The approximate location for the field site is indicated by a square in the image. The figure gives an overall view of the surroundings of the field site, including the land cover and whether any of the data may be affected by cloud or cloud shadow. Coordinates are listed in the Australian Albers system.
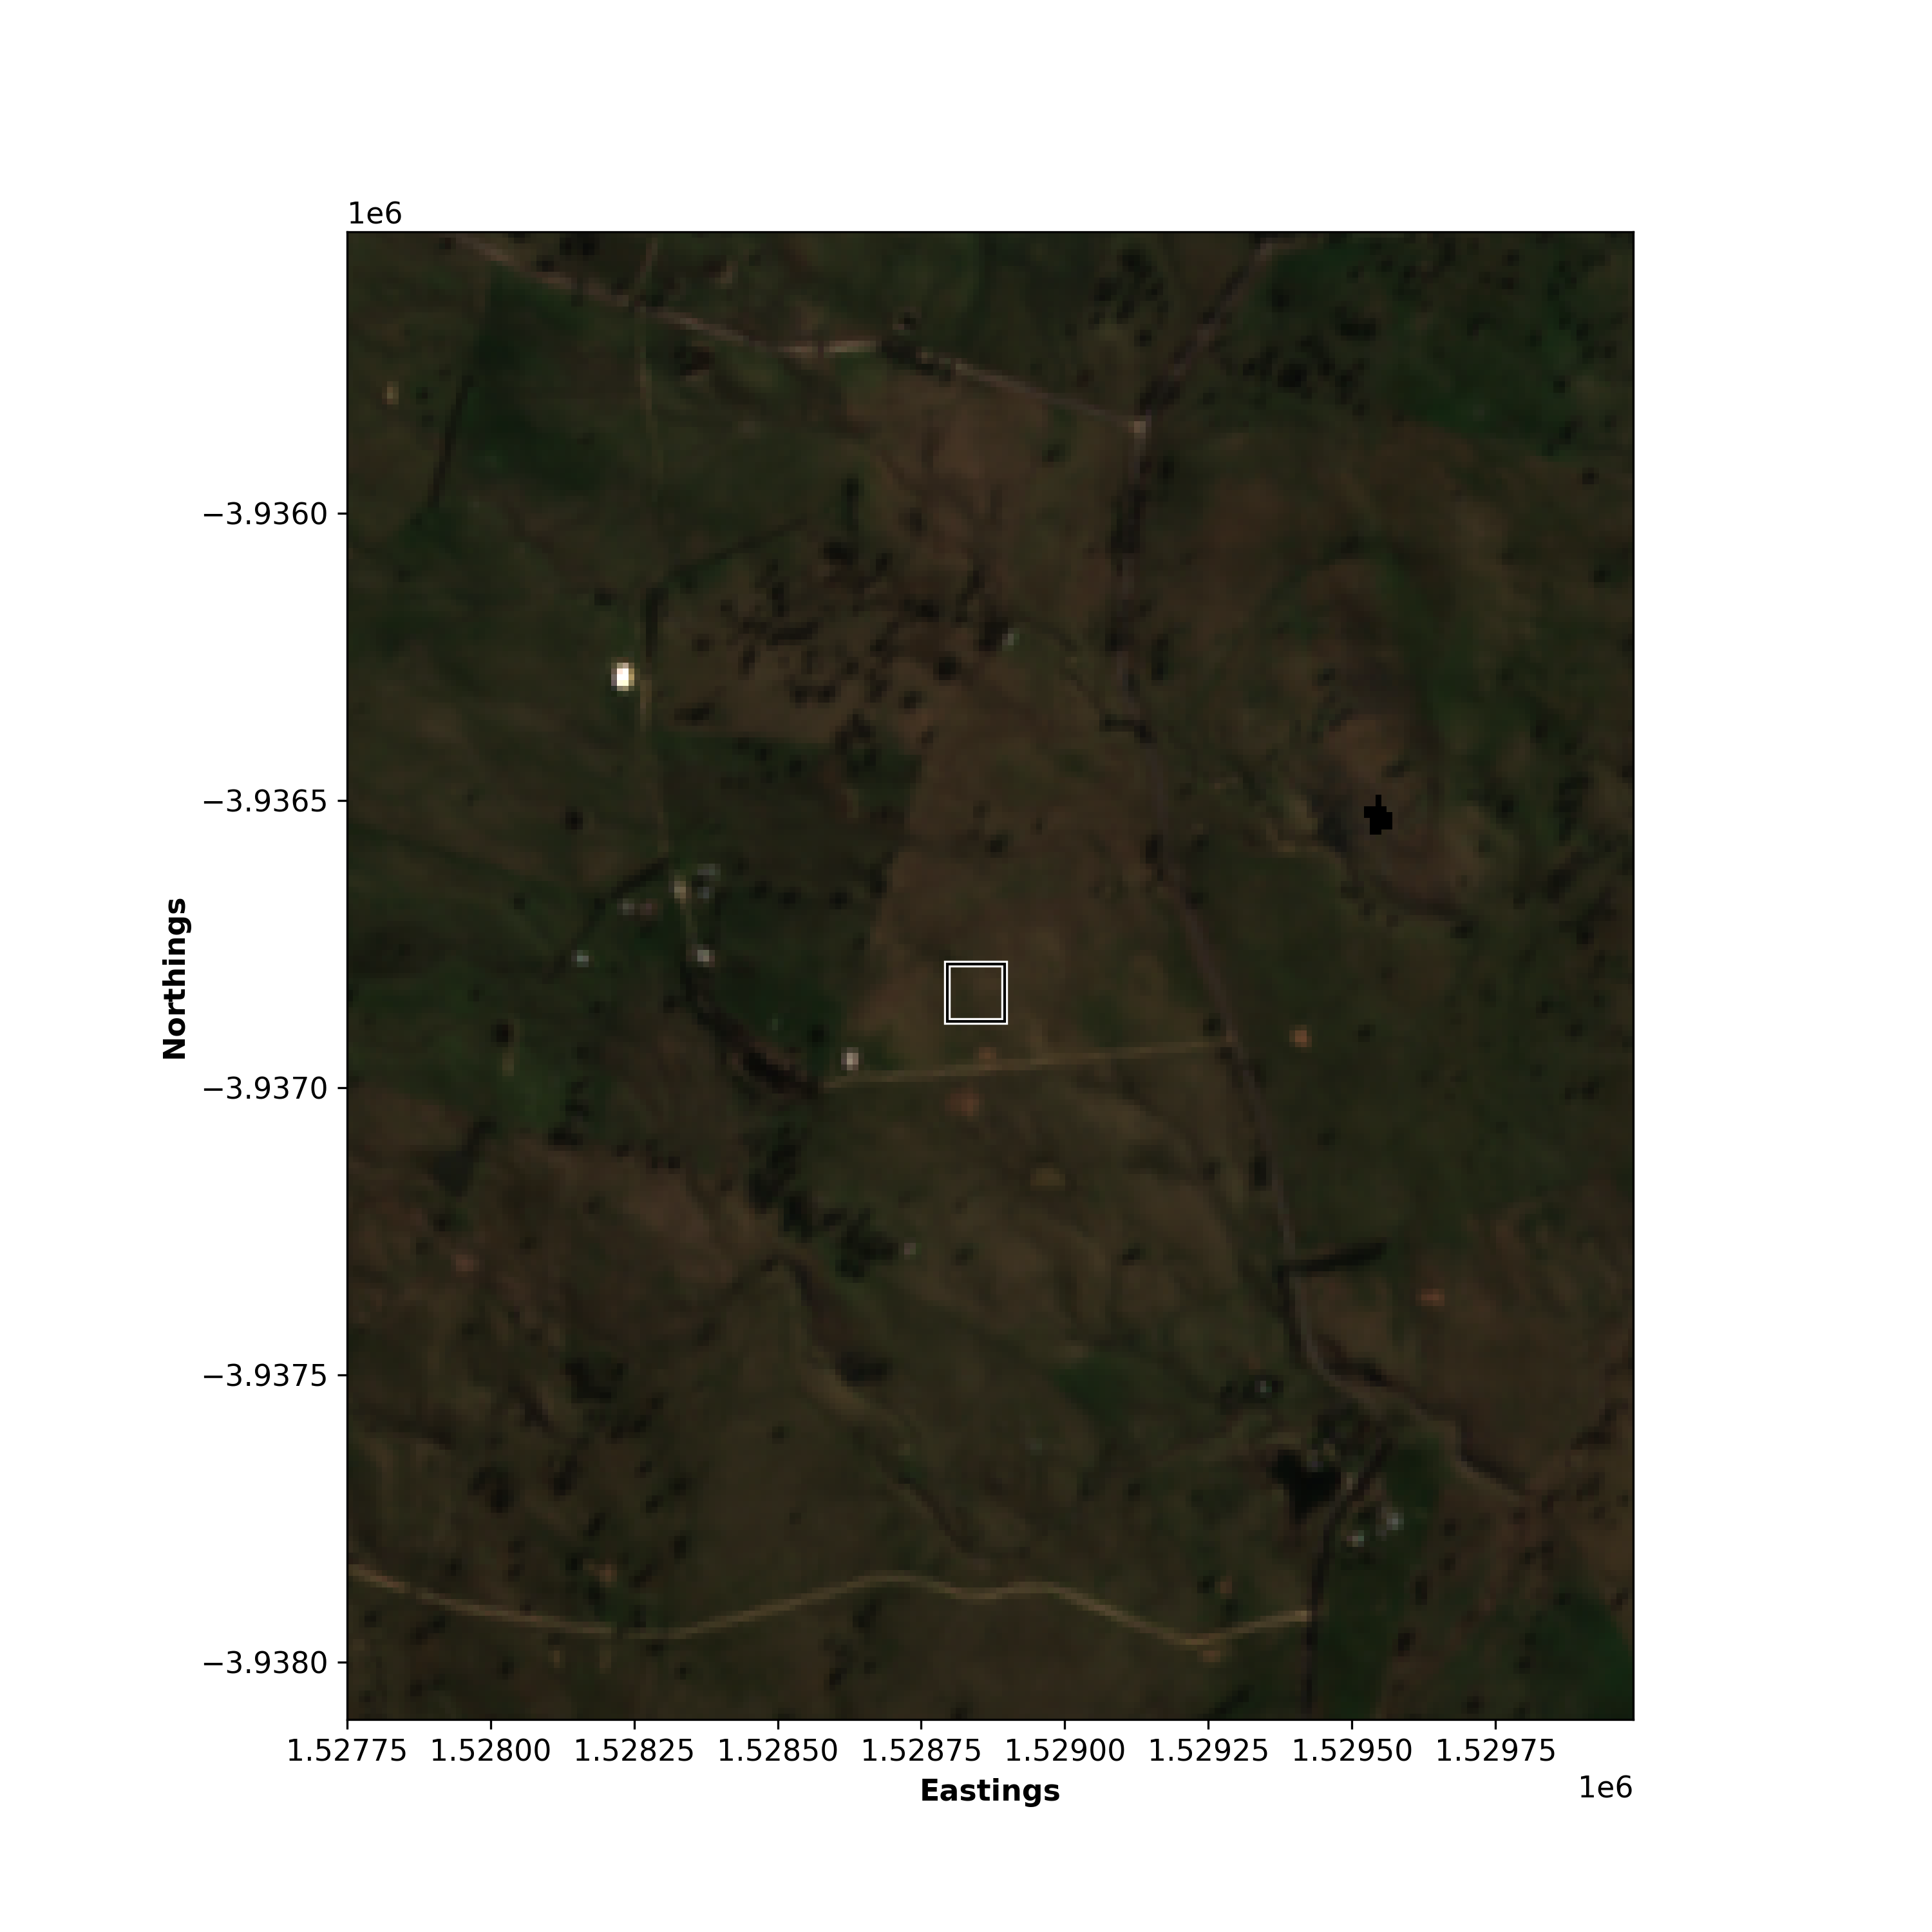
Figure 2 — The summary comparison of surface reflectance for each satellite band. The bands are provided in the same order as in the results table: CA, blue, green, etc. Vertical error bars are shown for the satellite data and field data and these correspond to the Sat rms and Field rms statistics in the results table.
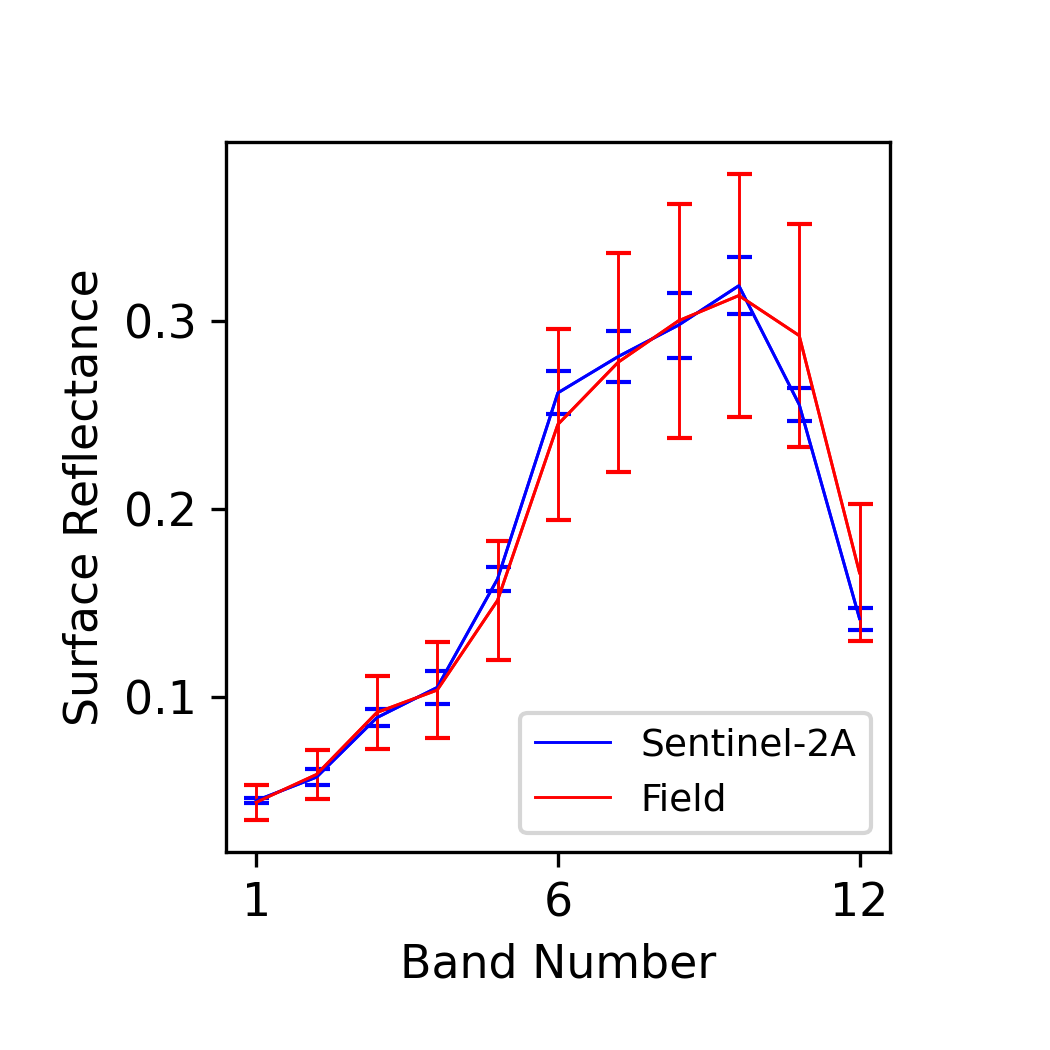
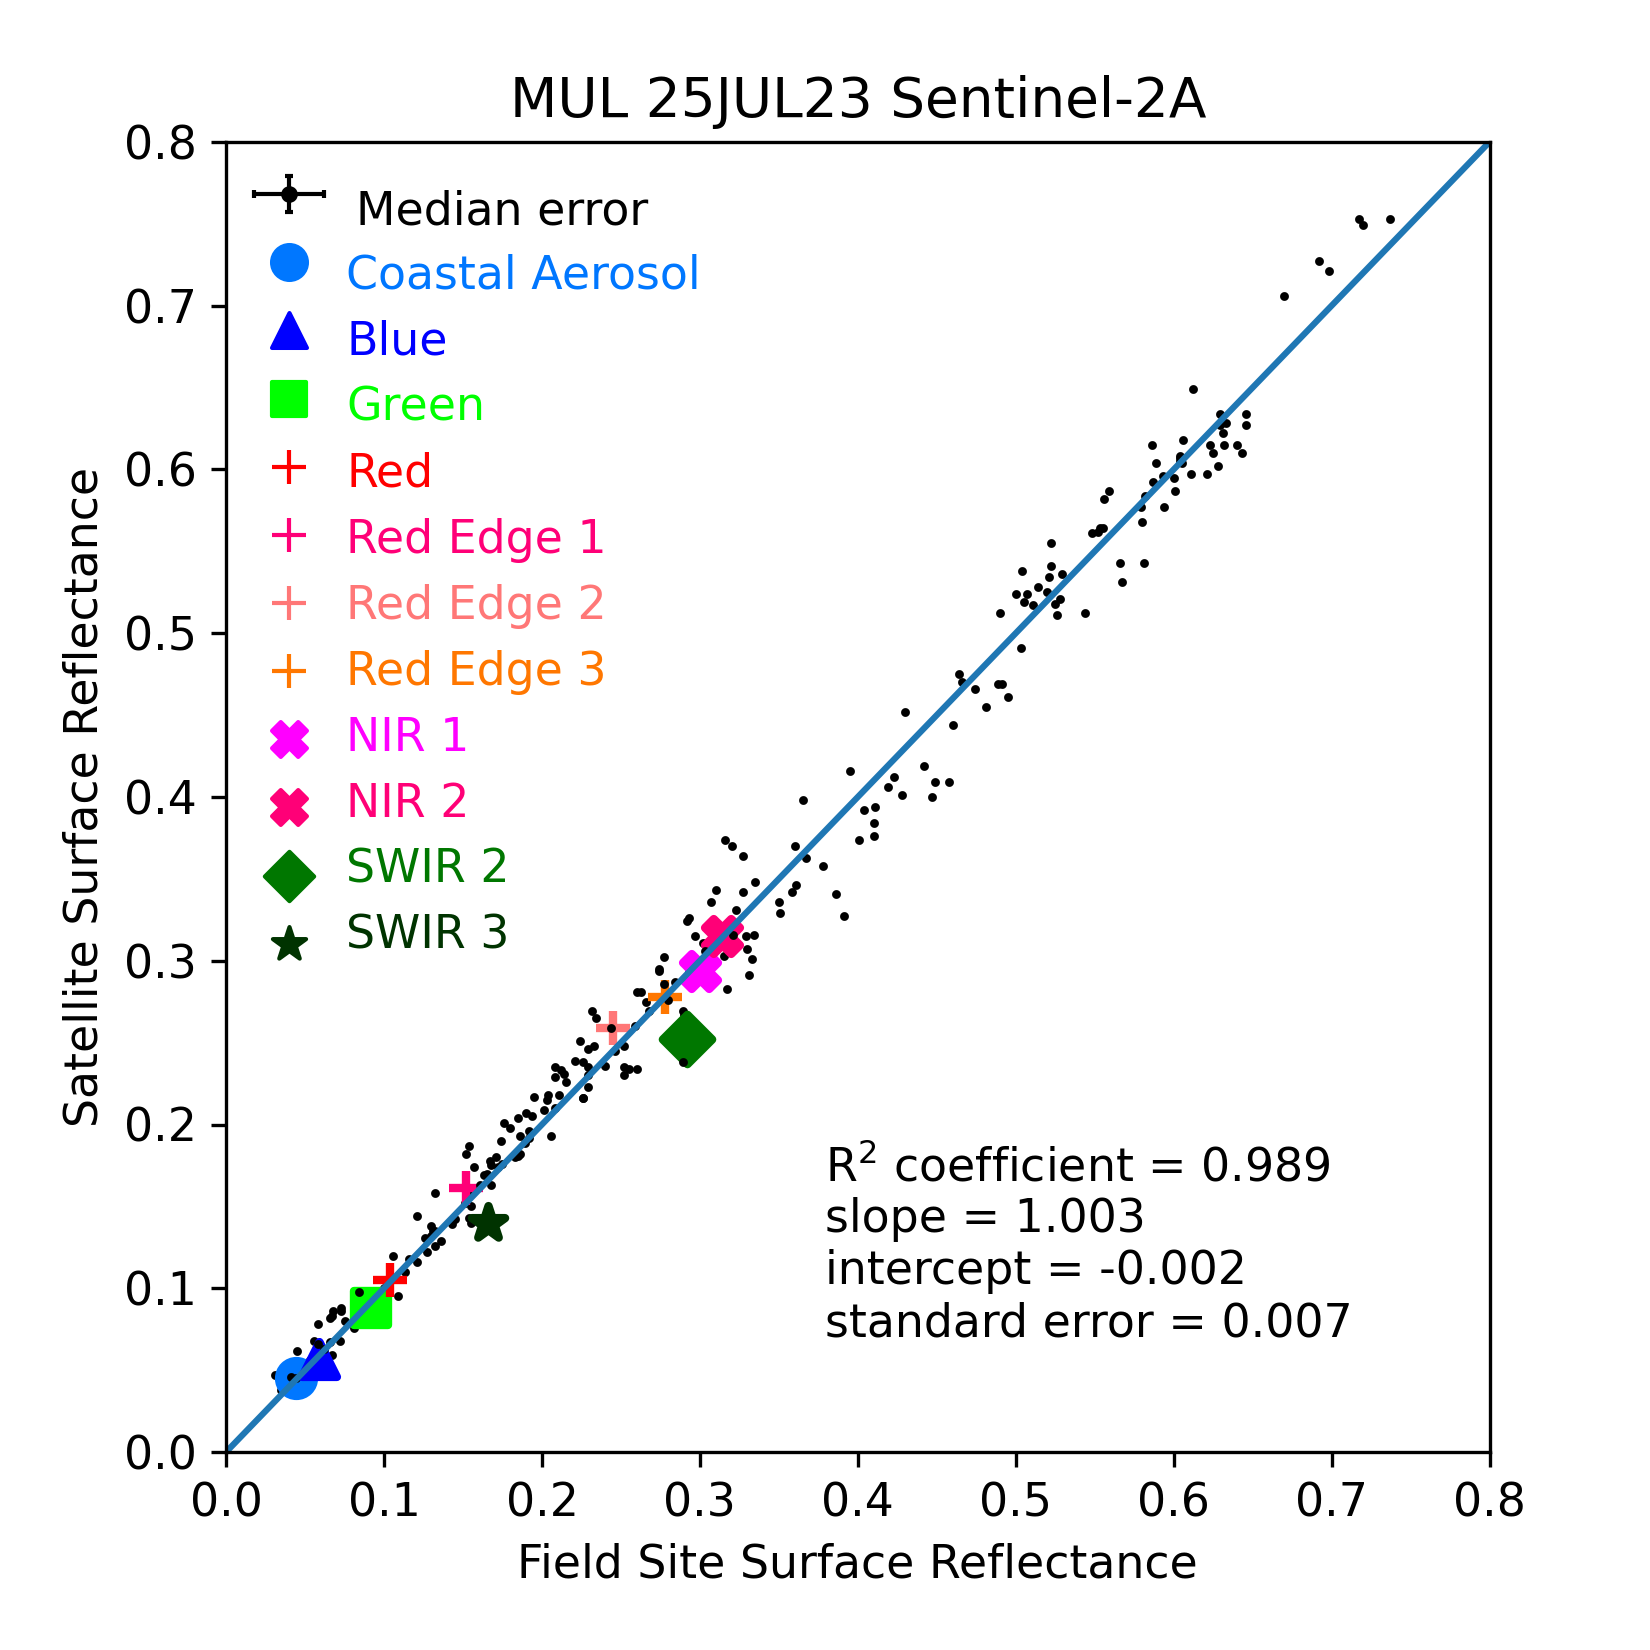
Figure 3 — A comparison between the current data (coloured symbols) versus all previous data for the satellite platform (black dots). The diagonal line represents the one-to-one correspondence between the field data and satellite data. Ideally, all data should cluster around this line. The line of best fit is not displayed, but its statistics are included in the bottom-right of the figure. The line of best fit is calculated from the current plus all previous data for this satellite. A \(R^2\) coefficient close to \(1\) means a very high degree of correlation between field and satellite data. A slope close to \(1\) and intercept close to \(0\) together indicate that overall, the satellite and field data match up closely.
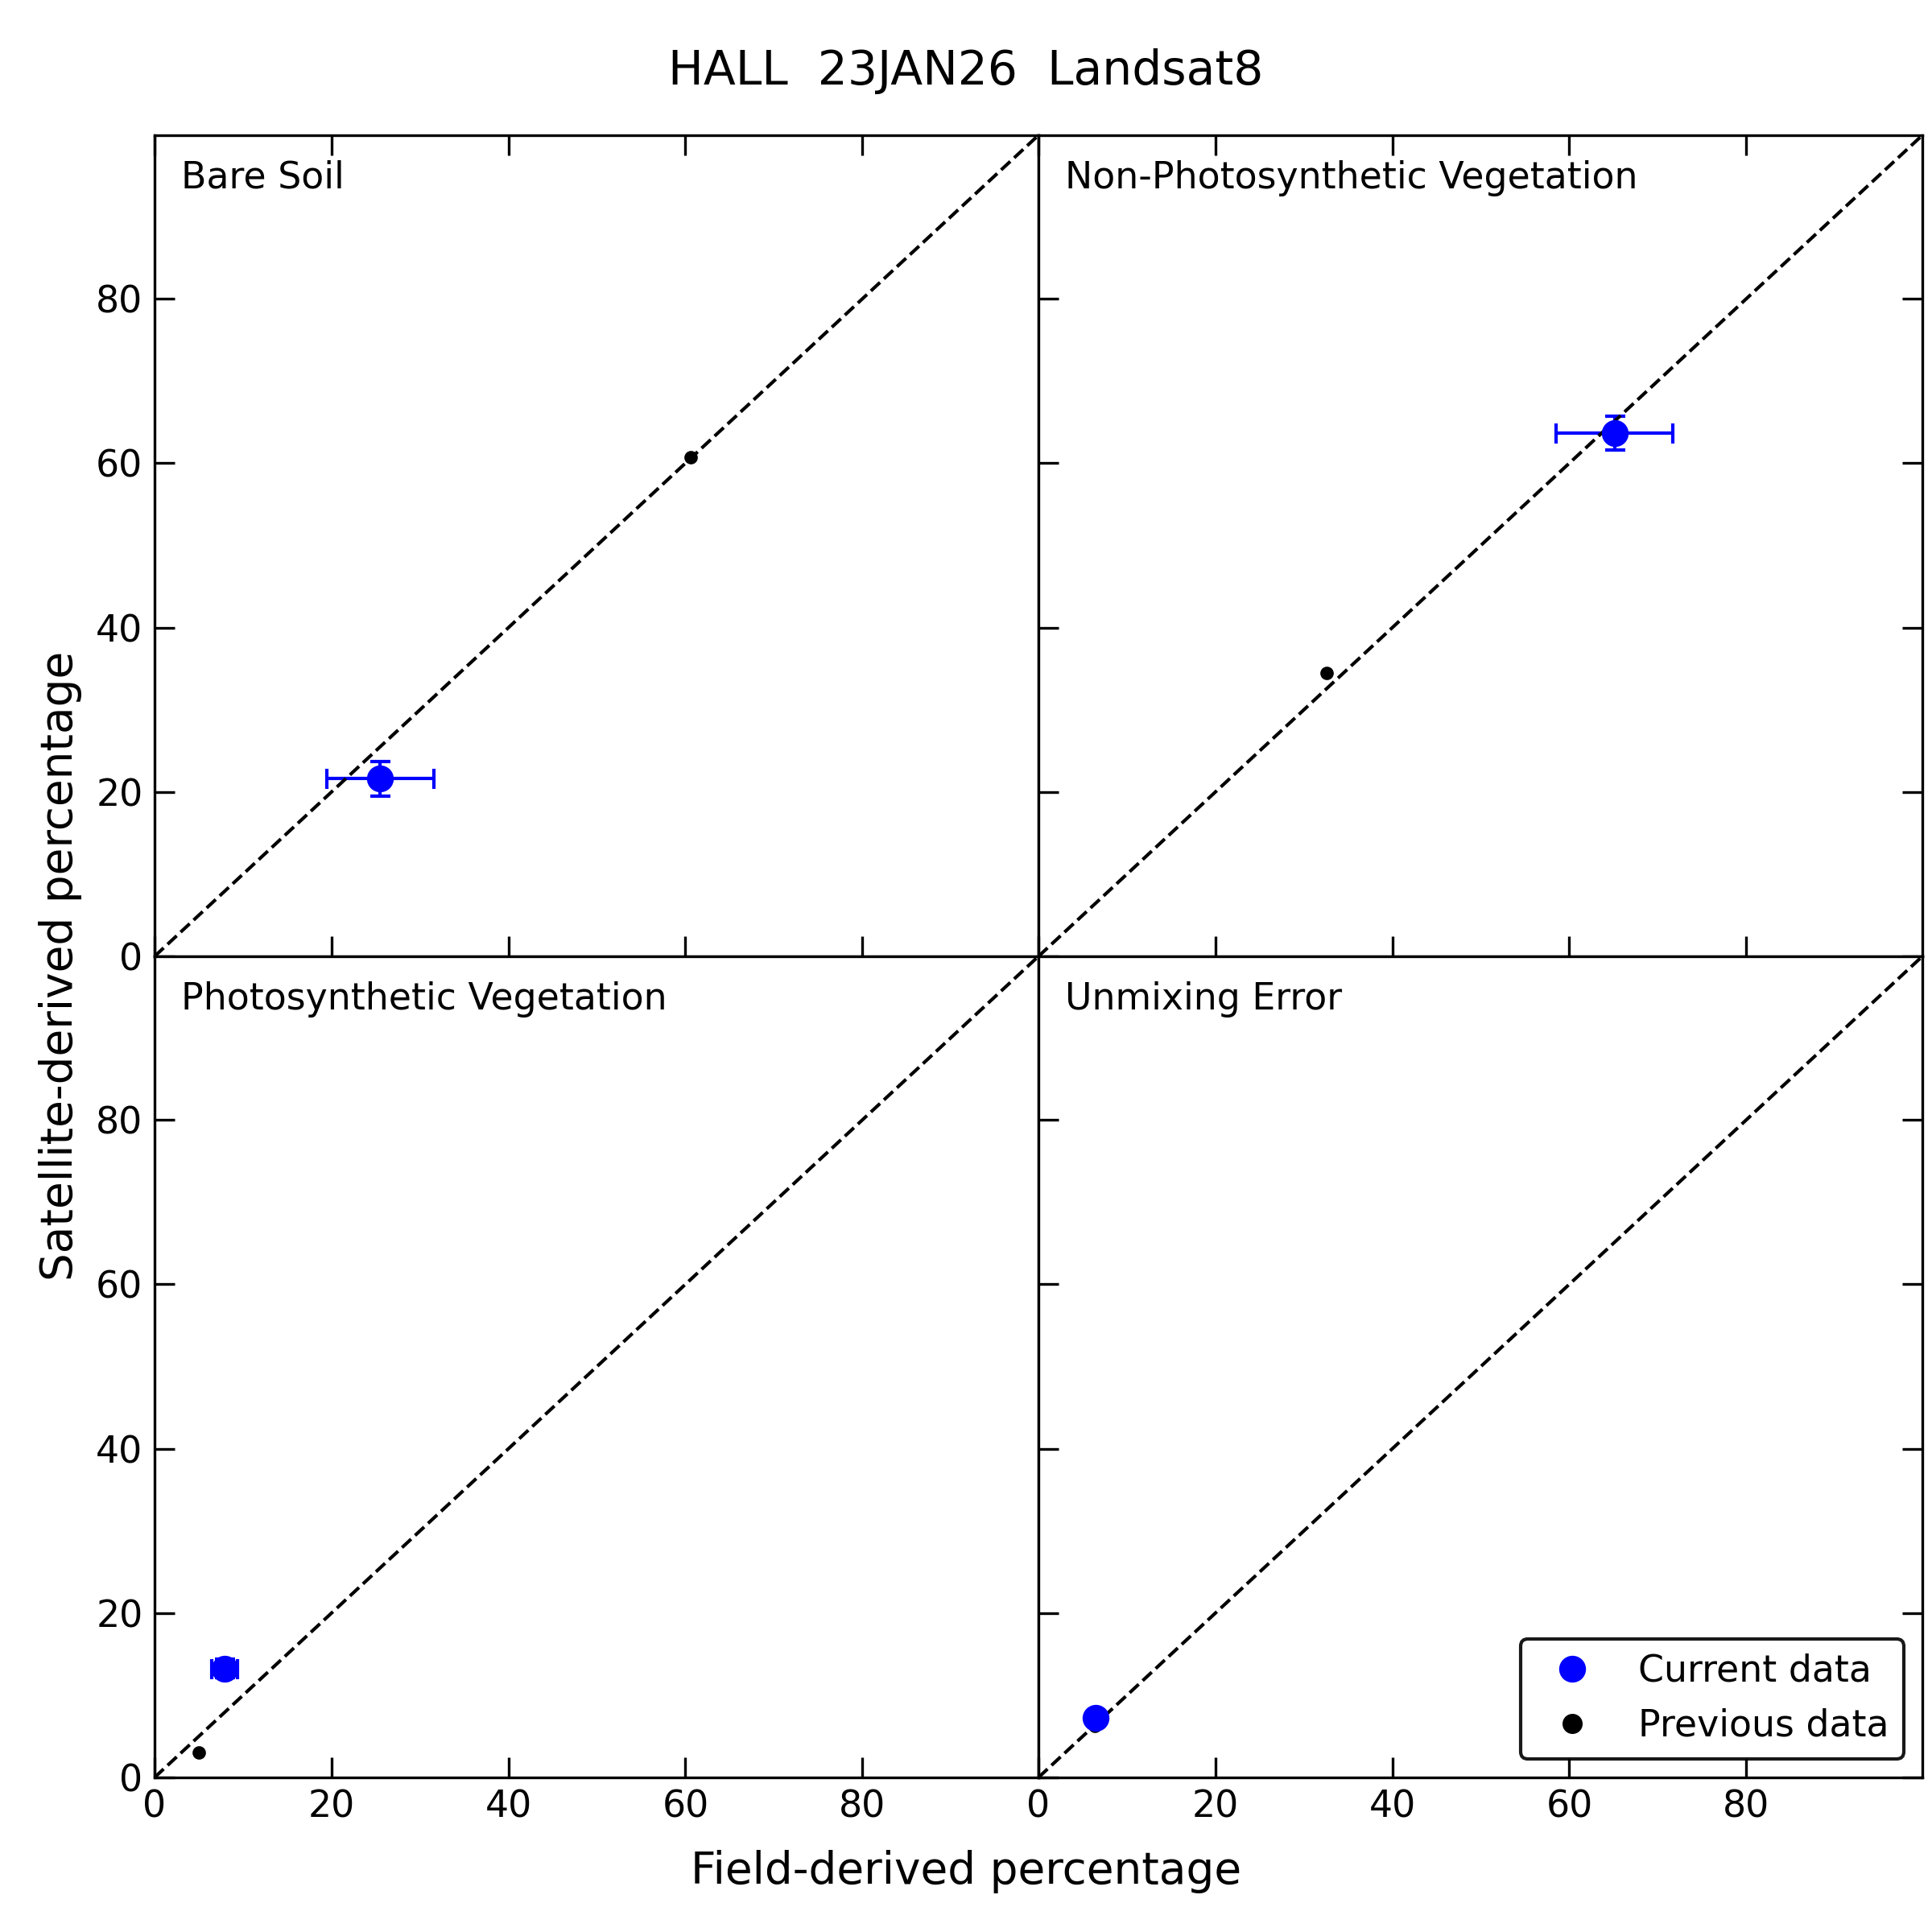
Fractional Cover
DEA Fractional Cover (FC) is a derivative product, based on measured surface reflectance. Since there is no agreed upon measurement standard of FC for the purposes of validating each site, the results presented here do not provide definitive validation of the FC product. Instead, the SR data from both satellite and field are processed through the same pipeline that generates the FC product. In this way, any differences between satellite- and field-based measurements will highlight the effect of these differences on the FC product, providing a measure of the robustness of FC. There is currently no FC product based on Sentinel measurements, so only Landsat-derived FC is tested.
Figure 4 — A comparison between the satellite- and field-based results for FC, separated into Bare Soil (BS; top row), Non-Photosynthetic Vegetation (NPV; upper row), Photosynthetic Vegetation (PV; lower row) and Unmixing Error (UE, bottom row). Each coloured pixel corresponds to the value at the location of the Landsat pixel derived either from Landsat or field-based measurements, where each pixel is 30 x 30m. The left column shows FC values based on the Landsat data (ie. the FC product), with the colours representing the fractional percent contribution of each parameter. In this example, green is equivalent to approximately 21% BS, 65% NPV and 13.5% PV, with UE between 7-8%. The middle column shows the difference between Landsat- and field-derived FC, as a percentage. The colours of the pixels, together with the scale on the colour wedge indicate how much difference and how much spread there is between Landsat- and field-based measurements, in terms of FC. The right-hand column shows histograms of the scatter of pixel value differences, together with statistics of the mean, standard deviation (SD) and median. In this example, it can be seen that the BS and NPV values derived from field measurements are lower than those values derived from satellite measurements, whereas the opposite is true for PV.
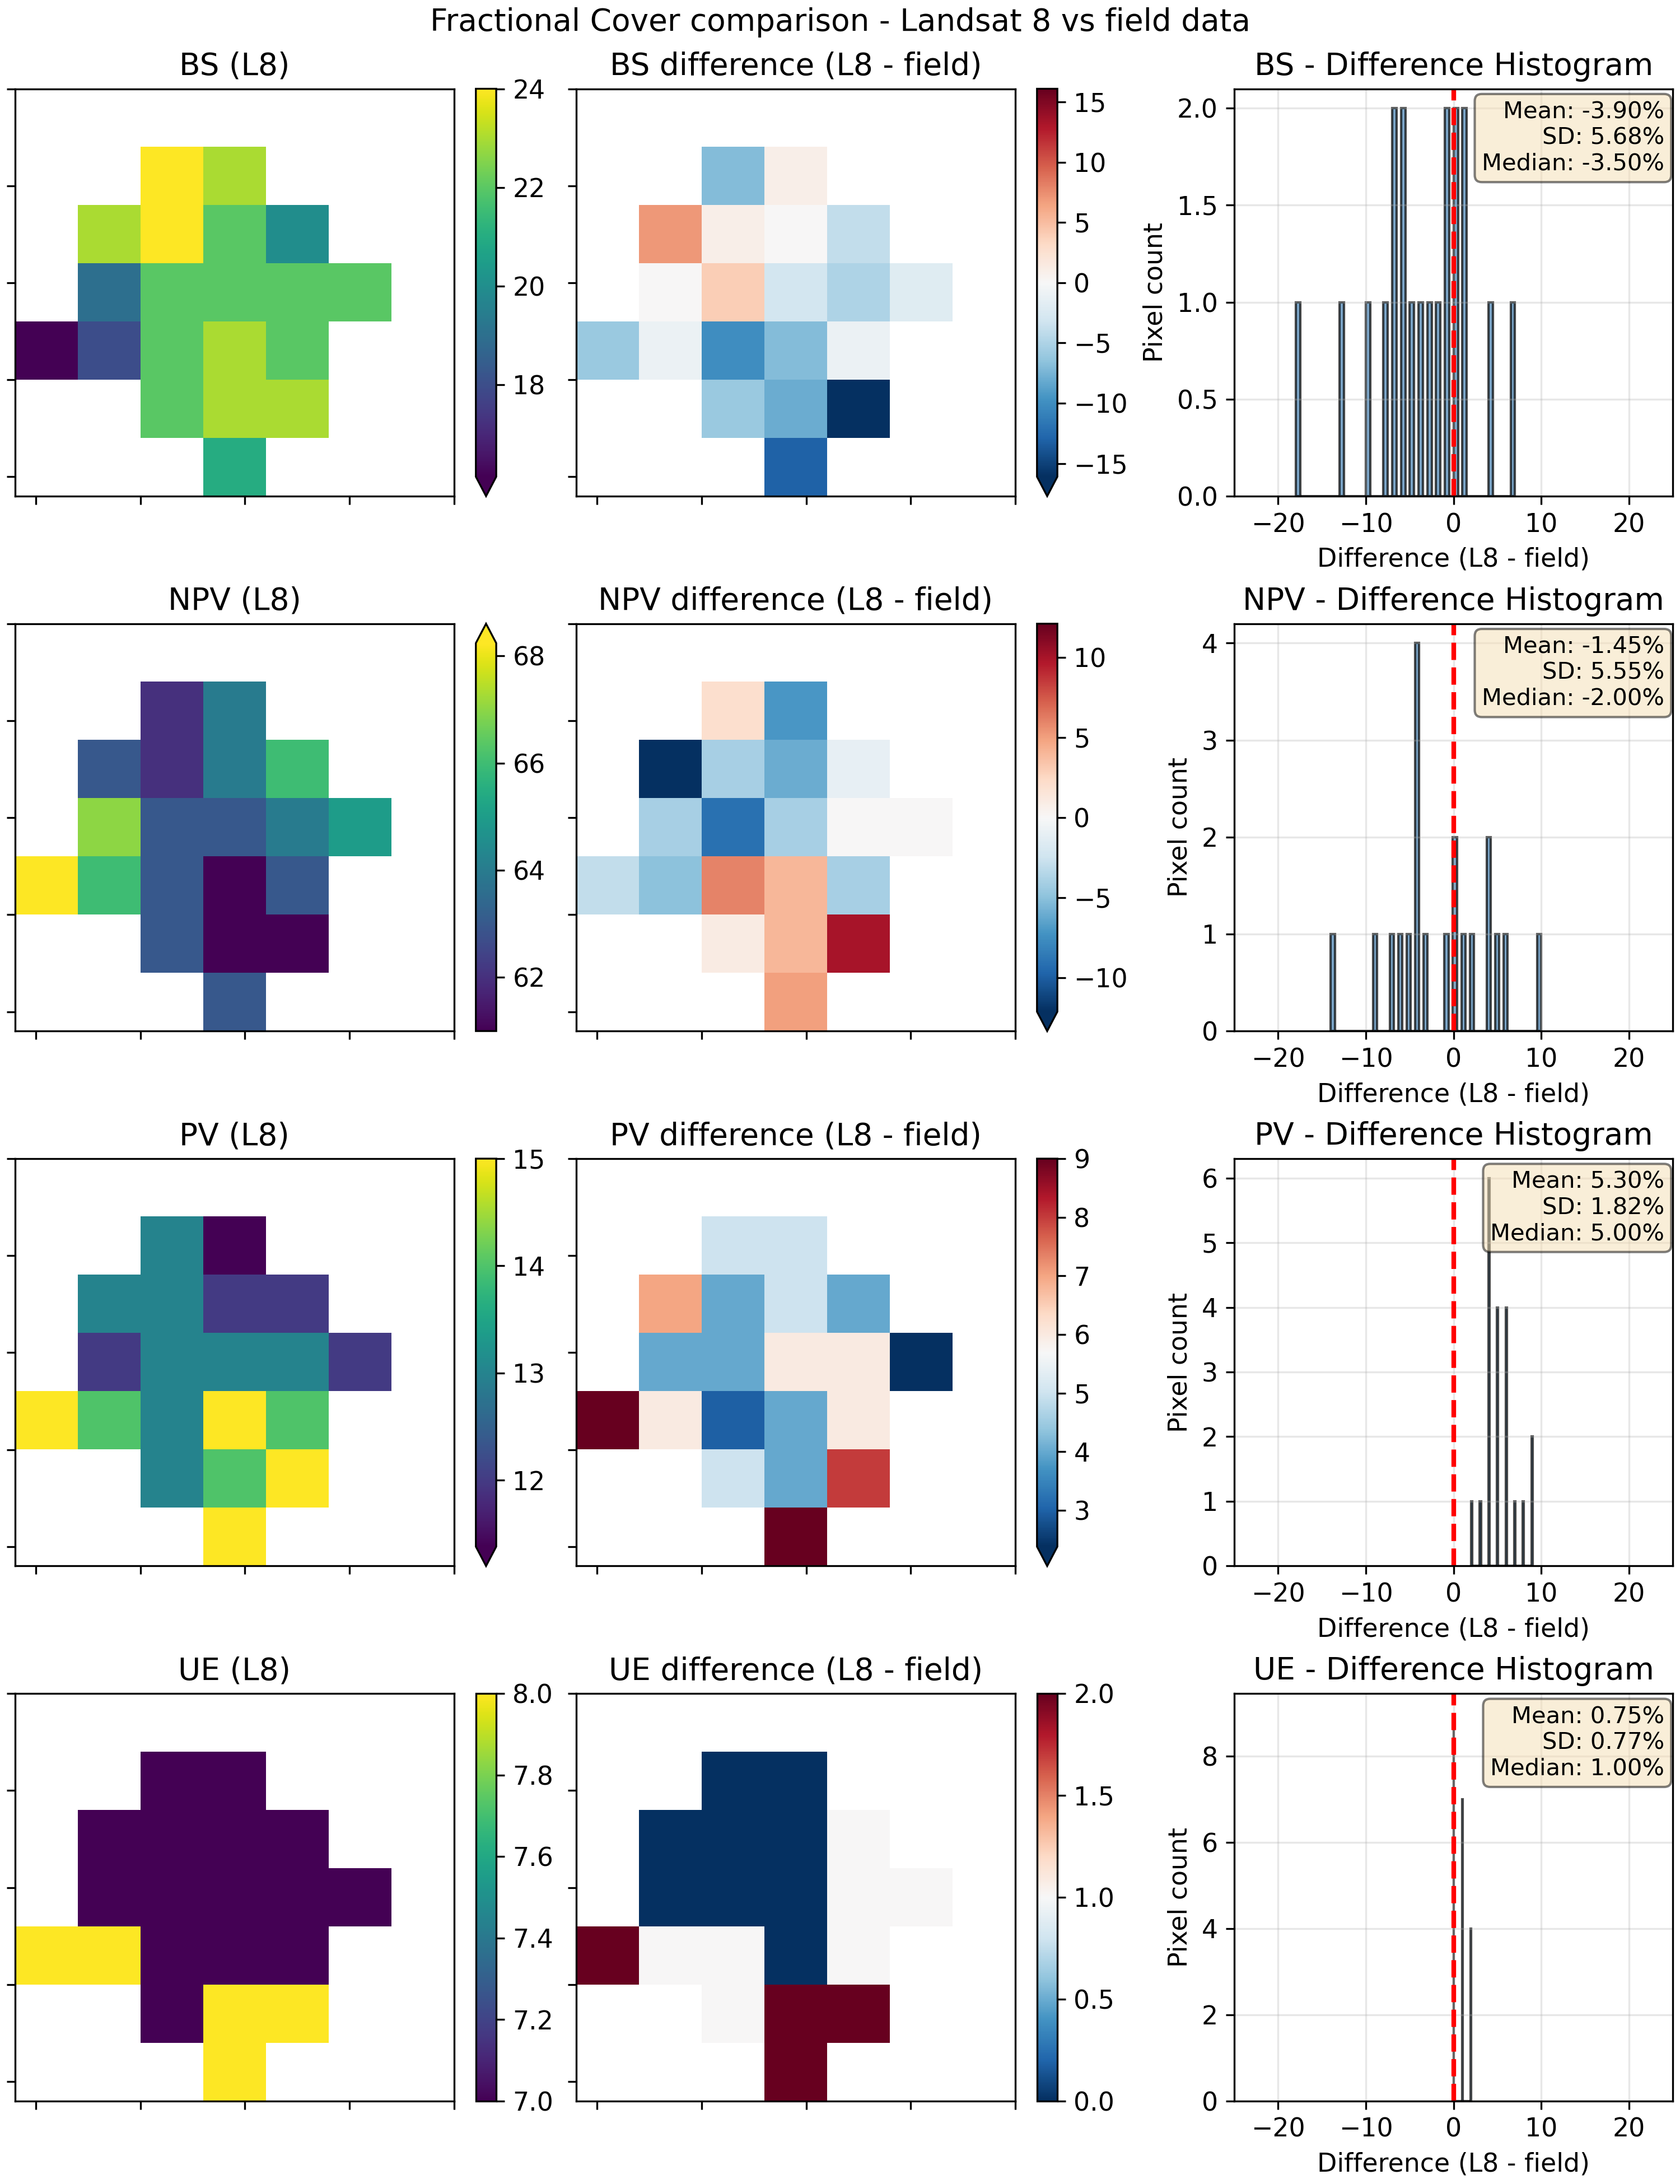
Figure 5 — A comparison between all satellite and field-based results for FC, with previous data shown as black dots and current data shown as blue dots with uncertainties. The dashed line in each panel represents the line of equality between satellite and field results and is NOT the line of best fit. Statistics in the bottom-right corner of each panel are based on the (unshown) line of best fit through the data points. A \(R^2\) correlation coefficient close to \(1\) means a very high degree of correlation between field and satellite-derived FC parameters. A slope close to \(1\) and intercept close to \(0\) together indicate that overall, the field and satellite-derived FC parameters match up closely.